Posts tagged with “docker” on Mark van Lent’s weblog2022-12-30T00:00:00+00:00tag:markvanlent.dev,2010-04-02:/tags/docker/index.xmlMark van Lenthttps://markvanlent.dev/about/Copyright (c) Mark van Lent, Creative Commons Attribution 4.0 International License.https://markvanlent.dev/favicon.ico<![CDATA[Open tabs — December 2022]]>https://markvanlent.dev/2022/12/30/open-tabs-december-2022/2022-12-30T22:58:20Z2022-12-30T00:00:00ZThe end of the year is a nice time to review my open tabs on my phone and
computer to see what’s worth saving and what is not. So here is
another round.
Note that I do not necessarily endorse the articles or applications I link to.
Most of the links to tools are here specifically because they seem interesting
to me, but I have no actual experience with them—hence the need for a reminder
on this list.
I have tried to group the links somewhat, but other than that they are listed in
more or less random order.
From the README: gron transforms JSON into discrete assignments to make it
easier to grep for what you want and see the absolute ‘path’ to it. It eases the
exploration of APIs that return large blobs of JSON but have terrible
documentation.
I had to (or wanted to) switch from using the name “master” for my main branch
to something else (“main” in most cases) for a couple of Git repositories. It is
not hard, but if you do not do it often, it is convenient to have a guide like this
to make sure you do not forget anything.
If you do not like the idea of automatically updating your containers with
Watchtower, you might want to look at this Docker Image Update
Notifier application.
I’m already running a Gitea instance and a
Docker Registry. Drone might be a nice
third component to automatically build projects and e.g. create Docker images
and push them to my internal registry.
I am already using a private certificate authority to create certificates for
the services in my homelab, but it would be nice to have a self hosted
ACME server to do the tedious work.
This tool might be what I need.
While officially a movie/series recommendation engine I use
this site regularly to check if I can stream a movie or series in my country and
if so, on which service it is available.
A book series by Scott Jucha, tipped in the
Security Now podcast. (The series is
mentioned in episode 887 for the first
time.) I’ve finished the first book and loved reading it!
I’m in the process of testing this backup tool to see if I want to switch over
to restic from my current rsync based script to backup my Linux machines to an
external disk. If I go that route, I’ll also have to have a look at
restic-tools.
When I was perparing my CV and a cover letter, I wanted the resulting PDF to
be more accessible. This article gave me useful instructions on how to achieve
that.
I’m toying with the idea of upgrading my home office with some LED
strips. Perhaps I’ll use Neopixels and a Raspberry Pi (or similar board) to do
this.
An article about how you can help your manager (help you).
]]><![CDATA[Pulling Docker images via a SOCKS5 proxy]]>https://markvanlent.dev/2022/05/10/pulling-docker-images-via-a-socks5-proxy/2022-05-10T20:14:56Z2022-05-10T00:00:00ZThis post describes how you can work around a firewall to pull Docker images
from a server that you do not have direct access to, using a SOCKS5 proxy.
Why would you want to do this?
Let us assume you are in a corporate environment. And let us further assume that
you want to pull Docker images from a registry that you do not have direct
access to from that corporate environment, for instance because the registry is
running on a non-standard port and is thus blocked by a firewall.
So for instance the following does not work for you:
docker pull registry.example.com:5678/image
Now let’s make a few more assumptions:
You have got SSH access to a machine outside of the corporate environment.
You are not violating any policy by bypassing the firewall, or have permission
to do so.
Workaround
To work around the issue, you can do the following:
Connect to a machine over SSH
Tunnel your docker pull command via that SSH connection.
Setting up the SOCKS5 proxy connection
You are going to use the -D option in your SSH command. This allocates a
socket listing on a port. Connections made to this port are forwarded over the
(secure) channel.
For example, if you can use host 172.31.10.5 as a proxy, the command would look
like this:
ssh -D 8080 172.31.10.5
Every connection to port 8080 on localhost is proxied via host 172.31.10.5.
Configure Docker
To make Docker use the proxy, you will have to configure dockerd. One way to do
this is to create the file /etc/systemd/system/docker.service.d/proxy.conf
with the following content:
(You most likely do not even need the HTTP_PROXY line, but it also doesn’t
hurt. ;-) )
Once this file is in place, you need to restart the Docker service:
systemctl daemon-reload
systemctl restart docker
When you run the following command again, the traffic is tunneled via your proxy.
docker pull registry.example.com:5678/image
Voilà, the firewall is bypassed and you can now pull your Docker image.
]]><![CDATA[Continuous deployment for this website using GitLab CI/CD, SSH, Docker and systemd]]>https://markvanlent.dev/2021/03/02/continuous-deployment-for-this-website-using-gitlab-ci-cd-ssh-docker-and-systemd/2021-11-27T22:20:54Z2021-03-02T00:00:00ZAlmost two years ago I wrote that
ideally I would not have to log in to my VPS to update this website. Well, that
moment has finally arrived.
A couple of weeks ago I decided to pursue continuous
deployment for this site.
Not because it is such a hassle to deploy a new version myself and also not
because it is needed that often, but because I wanted to explore the concept.
To summarize the most relevant parts of what I wrote in 2019:
The source code for this blog is hosted on GitLab.
Whenever I push a commit, GitLab CI/CD builds a new Docker image.
Once the build is done I SSH into the VPS this site is hosted from, pull the
new image and use it to run this site.
That last, manual step is now automated. The hardest part was figuring out a
method I was happy with; that is: not putting the keys to the kingdom in GitLab.
Not that I distrust GitLab, but if someone would get access to my GitLab
account, I would not want them to also have unlimited access to the VPS.
The solution I ended up with consists of three parts:
Configuration on GitLab to trigger a deployment.
A user on the VPS so the GitLab job can log into the VPS.
A monitoring service on the VPS to redeploy when a trigger is detected.
Before we can get into the job that I added to my pipeline, we need to prepare
some things. Starting with adding a couple of
GitLab CI/CD variables:
SSH_HOST and SSH_PORT: the SSH client needs to know
how to connect to the VPS.
SSH_USER and SSH_PRIVATE_KEY: the SSH client needs authentication
information.
SSH_KNOWN_HOST: the public SSH key of the server (SSH_HOST) so we can add
it to the known_hosts file and prevent
man-in-the-middle attacks. I got this
value by running ssh-keyscan <hostname> on my laptop and pasting the output
in GitLab.
In a moment we’ll see how these variables get used.
Since I want to use the digest of the Docker image that is built in this
pipeline, I’ve added an artifact to store the digest so we can access it later
on:
(The filters are probably not really necessary, but just in case there are
multiple images present, I want to be reasonably sure that I’ve picked the right
one.)
Most of the code is just to get SSH working. All the magic happens in the last
line. Note that in contrast to David’s article I don’t actually execute commands
on my VPS, instead I only send one string.
Now every time the pipeline is run on the main branch, the digest of the
freshly built Docker image is sent to my VPS.
VPS SSH configuration
On the VPS we need to make sure that the GitLab job can SSH into the machine.
The first step is to create a user to be used by GitLab (the SSH_USER variable
I mentioned above). Next we need to make sure that the SSH_PRIVATE_KEY stored
in GitLab can be used to log in. To make this possible and to mitigate the
risks of the SSH key in GitLab getting abused, I have added the following
content to the file ~/.ssh/authorized_keys of the new user:
Using the command option is an idea I got from
a ServerFault answer
and Mauricio Tavares' article
Getting the SSH_ORIGINAL_COMMAND.
In my case the ssh_commands.sh file stores the original command (in my case
the digest) in a file called deployment.raw.
VPS monitoring service
To actually deploy the new image, we need just one more piece in this puzzle: a
script to pull and use the Docker image.
I’ve opted for a systemd unit to monitor for the existence of the
deployment.raw file by adding the file
/etc/systemd/system/blog-deployment.path (note the “.path” at the end of the
filename):
In the deploy_blog.sh script I do things like reading the deployment.raw
file, checking its content, downloading the new Docker image, checking it and
restarting this website with the new image.
Summary
To recap my continuous deployment solution:
I push a commit to the main branch of the repo of this site.
GitLab CI/CD builds a new Docker image and sends its digest to my server.
My server watches for the existence of the digest file and uses it as a
trigger to deploy the new version of this website.
And now that I’ve written this down, I’m going to commit this article to Git,
push it to GitLab and then sit back and wait (im)patiently for my website to
update itself. ;-)
]]><![CDATA[Devopsdays Amsterdam 2018: reflection]]>https://markvanlent.dev/2018/07/04/devopsdays-amsterdam-2018-reflection/2021-10-26T18:57:58Z2018-07-04T00:00:00ZAbout a week has past since devopsdays Amsterdam. Time to write down
some of my thoughts.
The conference
This has been the third time I went to devopsdays Amsterdam. And I
love this conference!
Some of the reasons:
The organizers manage to get great speakers with interesting talks
on stage each year.
I had heard about Go, some of my co-workers
have some experience with it, but I never wrote anything in the
language. I was curious about it though.
The workshop from Michael
Hausenblas
was a nice intro. Based on what he told and showed us I cannot say
that I expect that Go will replace Bash and Python for me. However, I
will make some time to actually write some code myself to get a better
feel for it.
Monitoring with Elastic
We are already using the Elastic Stack in
some places at work, but I have not used it for monitoring purposes. (I
gravitate towards Prometheus combined with
Alertmanager for alerting and
Grafana for dashboards with graphs.) However, Philipp
Krenn showed
us
that you can also do very interesting things with
Kibana in the monitoring and debugging realm.
Especially since you can correlate metrics with logs in the same tool.
It was a good workshop with lots of hands-on tasks. But it went a bit
too fast to make it stick. I would have to spend more time on a
Kubernetes cluster to really understand everything and get fluent with
it. Luckily there is lots of information on
container.training (including the
sheets of this workshop) and there are plenty of cloud providers where
you can get a Kubernetes cluster without having to create or maintain
it yourself.
The talks
The talk that resonated most with me this year was the one from Waldo
Grunenwald about product
teams.
Perhaps because (in my opinion) this is something that could be better
in my job. Product management, development and operations are three
different teams with different managers. Then again, I currently try
to be the “ops guy” in our development team so that’s also DevOps, right? :)
I have been using Emacs for
quite a while. I was a Vim user in the past,
but switched somewhere between 2007 and 2009. (The first time I wrote
about Emacs here was in
2009.)
I have tried PyCharm a couple of
times and it is a really nice editor with very useful features. It
just never stuck with me and I always went back to Emacs after a
while.
During the conference I used Visual Studio Code
to write my notes. And I have to say I quite liked it. I intend to also give it
a go at work. Who knows, I might even switch…
]]><![CDATA[Devopsdays Amsterdam 2018: workshops]]>https://markvanlent.dev/2018/06/27/devopsdays-amsterdam-2018-workshops/2021-10-26T18:57:58Z2018-06-27T00:00:00ZJust like the previous couple of years, devopsdays Amsterdam started
off with a day of workshops. This year I attended workshops about Go,
monitoring microservices and Kubernetes.
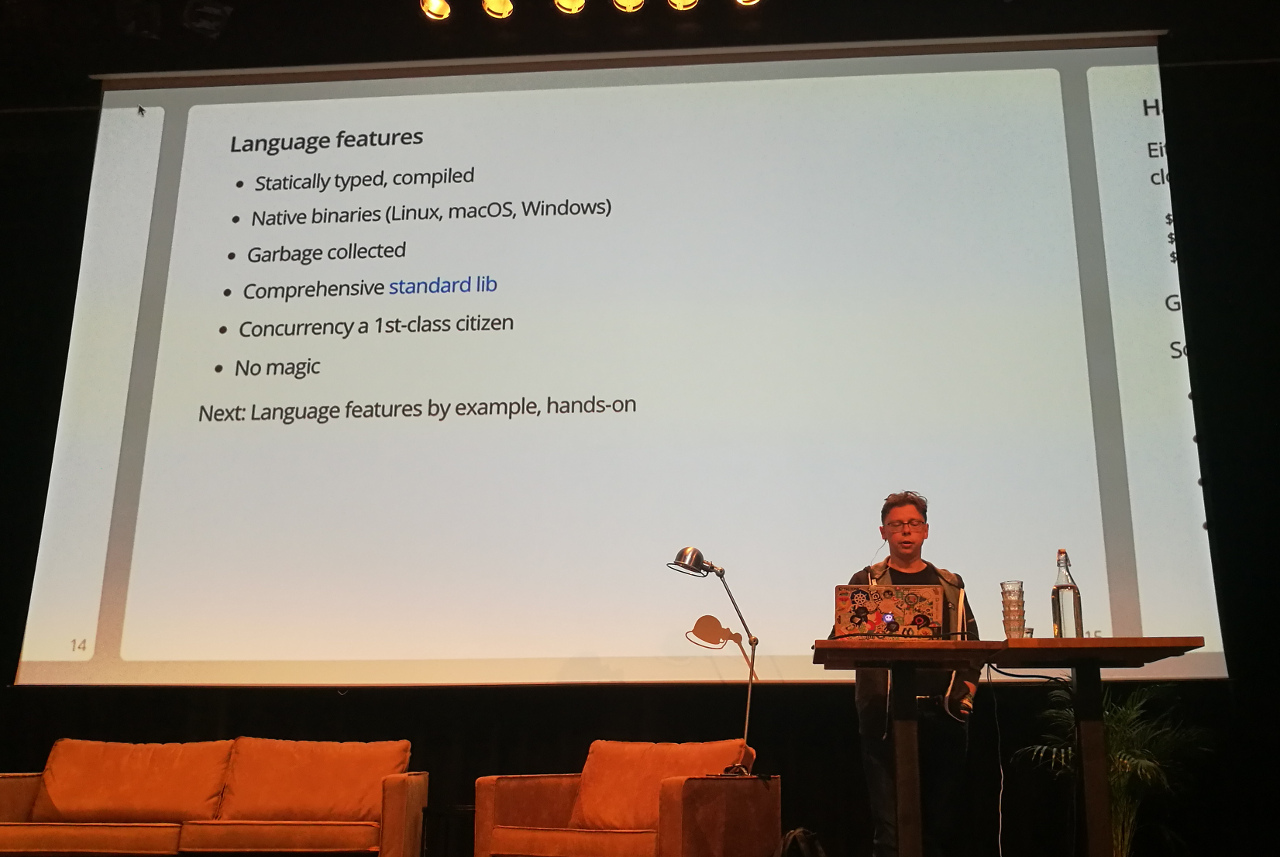
Go for Ops — Michael Hausenblas (Red Hat)
Michael walked us through the features of the Go language by giving numerous
examples. This is a workshop that usually takes a full day so we were in for a
nice ride.
One thing he mentioned that he liked about the language is that there is (almost) no
magic involved.
Some things that stood out to me, Mark, (as someone who writes Python most of
the time and does not know much about Go):
There are no objects in Go; they are “structs” and methods (functions bound to
a struct) (Note from Mark: Steve Francia wrote “Is Go an Object Oriented
language?” which seems like a
useful article).
You need to create a file first before you can write to it. (In Python you
open a file for writing and it is created if needed).
To format dates you have to use a special date in the formatter: Jan 2,
15:04:05, 2006 (which is basically 1, 2, 3, 4, 5, 6).
The standard library is very comprehensive. (This is actually something Go has
in common with Python.)
Slide 27:
if you feed the printf function a different type, e.g. a string, it will not
even compile. (Mark: this is something I’m not used to, coming from Python.)
To expose things like functions (make them available to other packages): start
the name with an uppercase letter. Functions starting with a lowercase letter
are internal/private to the package. If you try to access an internal
function, you get a nice error message (again: at compile time).
Slide 31: “log.Fatalf()”
triggers the os.Exit(1) you can see when you run this example.
You can add a call to the defer function at the end of a scope (e.g. “defer f.Close()”
in slide 33).
Since the Go runtime will execute this always (even if there was an error), you can
use this e.g. as a cleanup of an open file. You can have as many defers as you
like; they will be executed in reverse order.
Starting with writing tests is quite simple: create file with <module name>_test.go.
The function name of the test is irrelevant as long as it starts with “Test”.
Run the tests with “go test” (plus options, if you like). Go offers test
coverage information. Tip: use a nice editor/IDE and integrate running the tests
and code coverage there.
Google, where Go was created, uses a monorepo. As a result they did not need
dependency management in Go. Use e.g. dep to
help you out here. It looks like vgo
will be part of the language in the future.1
You can either trust upstream (and Github to be available) and not put your
dependencies in your repo, or chose not to and version control the code you
depend on yourself.
About running a Go application in a container: you can either pick an image with
debug tools (like centos:7), or pick a minimal image like alpine or
scratch as the basis of your image. You have to decide whether you want the
smallest image possible or want (some) tools included.
For Michael, Go replaced a lot of Bash and Python. However, Michael is not
convinced that Go is a good fit to write a complete web application in, for
instance. But decide for yourself. On slide 56
there are a couple of links to some pages with criticism.
As already stated, Go has an extensive standard library. Michael advises to use
it. If it does not have or do what you want, your second best option is to use a
drop-in replacement. Only if that is not possible, search for a package with a
different API.
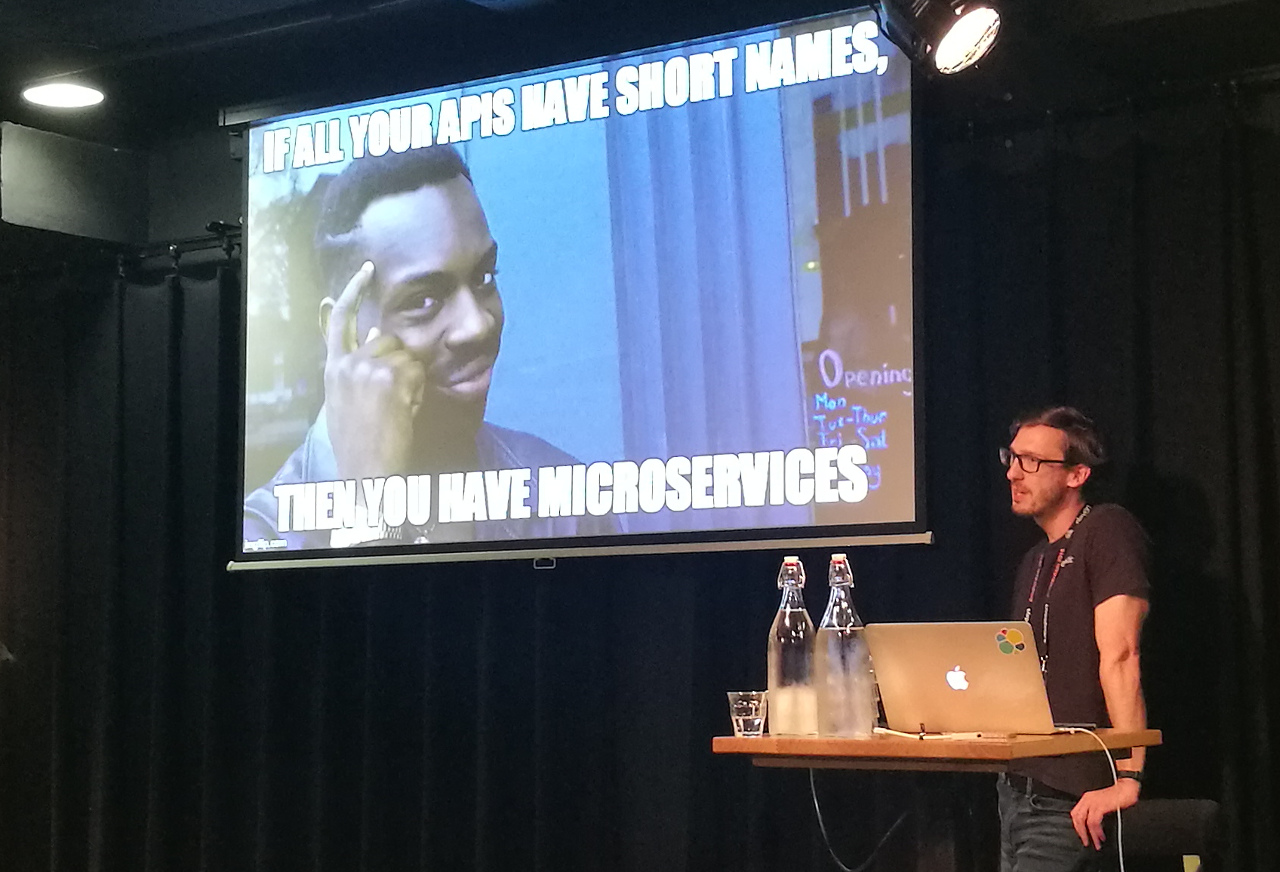
Monitor Your Microservices — Logs, Metrics, Pings, And Traces — Philipp Krenn (Elastic)
Distributed services make debugging … interesting.
The code for this workshop, a highly monitored “hello world” app can be found on
Github.
The server provided for the workshop is an Amazon Lightsail instance created
with Terraform and provisioned with Ansible. (The code for this deployment is
also included in the aforementioned repo.)
Notable changes in Kibana 6.3:
It has tools to manage the Elasticsearch indices.
In visualizations the aggregation previously called “calculation” has been
renamed to “math.”
Packetbeat is using libpcap, just like Wireshark. Philipp thinks the future of
Packetbeat is in tracking down DNS + TLS errors since you should encrypt the
data between your services (which means that Packetbeat can no longer extract
much information from the packets).
Previously you used Logstash to get the Nginx access logs into Elasticsearch.
Filebeat modules can help you there. Filebeat is just forwarding the data; the
parsing is done by Elasticsearch. Filebeat has processors to enrich events with
e.g. cloud and host metadata (quite cheaply actually since this information is
collected on startup of Filebeat and cached).
Auditbeat has the same type configuration as auditd.
Journalbeat (from a third party) can be
used for journald support. Philipp doesn’t guarantee anything, but this is on
the list of the Elastic team and he hopes there will be official support for
journald.
You can have a rule to collect multiline messages, like stack traces, together in
one document by telling Filebeat that if a line start with e.g. a timestamp, it
is the start of a new line and if it starts with e.g. a space it is part of a
stack trace. You could also use structured logs (which is recommended if you
can).
As of version 6 you can tell beats to enable (and update) the related dashboards
in Kibana.
For alerting with the Elastic stack you need a commercial license.
The machine learning (also only available in the commercial X-Pack license)
takes three iterations to detect a pattern. For example the pattern of how
much traffic your application receives on a workday can be learned in three
days. For a weekday/weekend pattern, it would need three weeks.
Kibana also has support for APM (Application Performance Monitoring). There are
agents for e.g. Python and Node and a bunch of others (some in beta or alpha
stage, see the docs).
Elastic is working on Index Lifecycle Management (ILM) which will run as part of
the cluster. Philipp is not sure when it will be available though. For now use
Curator.
Elasticsearch already supports metrics aggregation (called “rollups”) via the
API. In a future version there will also be an graphical interface to configure
this.
Philipp compared his workshop to Lego. He showed us some configuration,
visualizations, etcetera but “some assembly is required.”
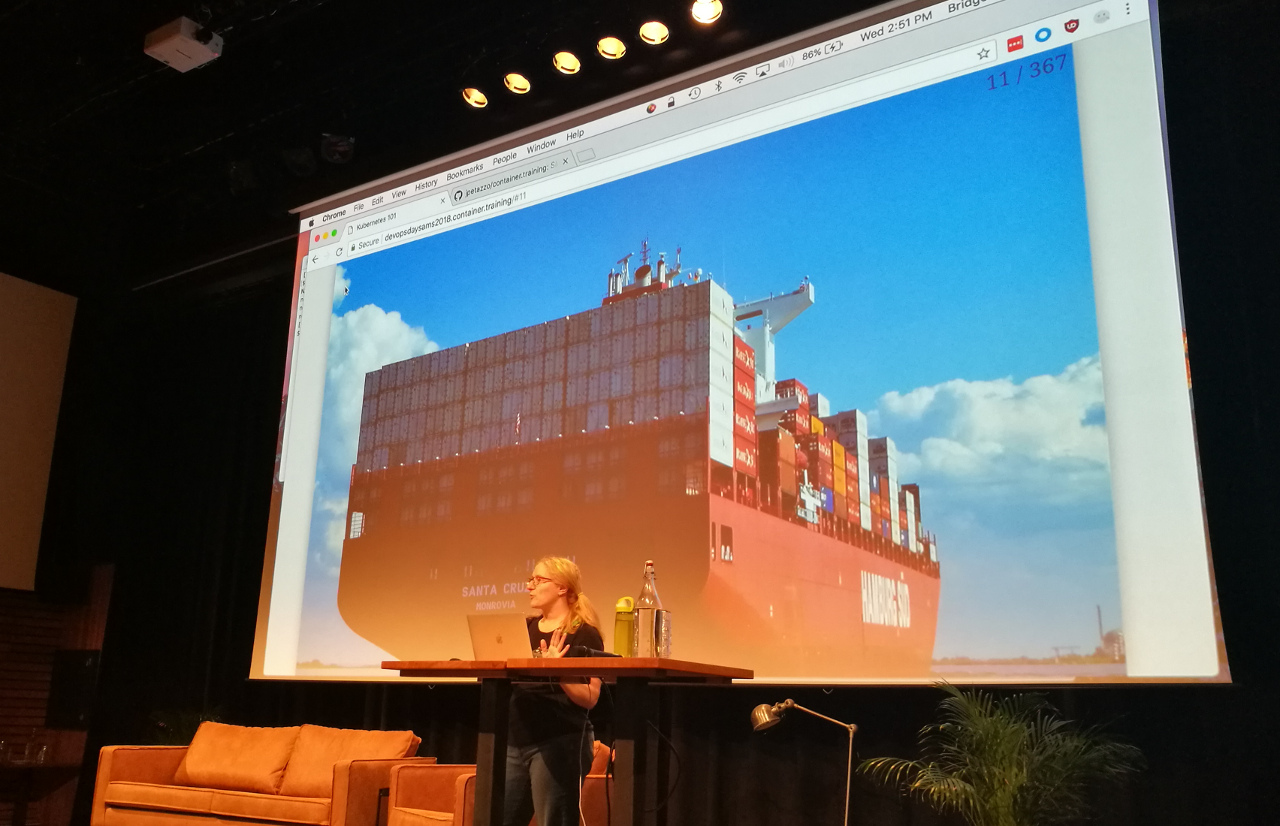
Kubernetes 101 — Bridget Kromhout (Microsoft)
This was a fast paced, highly interactive workshop about Kubernetes so I only
took a few notes. However, the slides have so much information on them, you can
follow the workshop perfectly fine without comments from me.
Warning: we have done stuff you should not do in production. :)
Kubernetes is highly unopinionated.
By default Kubernetes uses one big, flat network. However, you can configure
Kubernetes so that customers cannot access each other.
In real life you would not host your own Docker registry in the production
environment. We do it in the workshop because it is easier than messing with
credentials to other registries.
Kubernetes has extensive role based access control support.
Update 2021-10-08: According to the deb repository: Dep was an official
experiment to implement a package manager for Go. As of 2020, Dep is deprecated
and archived in favor of Go modules, which have had official support since Go
1.11. For more details, see https://golang.org/ref/mod.↩︎
]]><![CDATA[DockerCon EU 2017: day two]]>https://markvanlent.dev/2017/10/18/dockercon-eu-2017-day-two/2021-10-08T19:02:07Z2017-10-18T00:00:00ZThese are my notes of my second day at DockerCon.
Just as with
yesterday’s notes,
these are just notes and not summaries.
General session
The general session was mostly devoted to modernizing traditional
applications, saving costs and customer success stories.
Tips and Tricks of the Docker Captains — Adrian Mouat (Container Solutions)
Several small tips and tricks.
Daily development
You can configure the output of the “docker ps” or “docker container ls” commands with the “--format” argument. You can also
put your preference for the formatting in your ~/.docker/config.json
file under the psFormat property (see the documentation on
configuration files. Warning,
this file also contains your passwords to Docker registries so do not
put it online.
Cleaning up:
Remove dangling images: docker image prune
Remove stopped containers: docker container prune
Remove unused volumes: docker volume prune
Remove unused networks: docker network prune
Remove all of the above: docker system prune
Building images
The “.” at the end of a Docker build command means that the target
(the current directory in this case) is sent to the Docker Daemon as a
tarball. Use the .dockerignore file to exclude large directories.
Alpine is pretty small (5MB). Couple of gotchas though, like:
uses musl instead of glibc
uses its own package manager
If you are looking for an alternative, have a look at the Debian Slim
images like debian:stretch-slim. They are (at the moment) 30MB or
smaller.
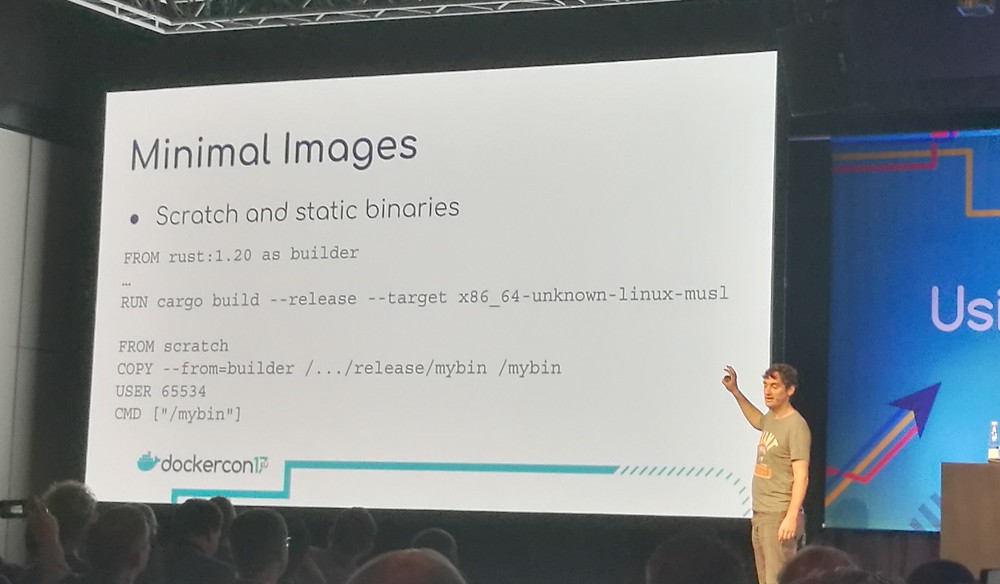
If you build static binaries, you can put the binary in the scratch
image. Since there is no operating system on top of the kernel, you
cannot use user names. You can use IDs, USER 65534 maps to the the
“nobody” user.
Container lifecycle
Do not require containers to start in sequence. Instead have a
container wait for a service it depends on (including backoff) and
include this in the application itself or in a startup script.
When Docker stops a container, it sends a SIGTERM signal, waits for
10 seconds and then hard kills the container with a SIGKILL. If the
latter happens, you cannot tidy up properly (e.g. close network
connections, write a final log entry, etc). So try to prevent this.
Tini, used for signal forwarding,
is integrated in Docker now.
A benefit of healthchecks is that Swarm will only route to healthy
containers. Note that healthchecks are run inside the container
itself, not on the host. This might mean you will have to install more
software in your image (e.g. curl).
Security
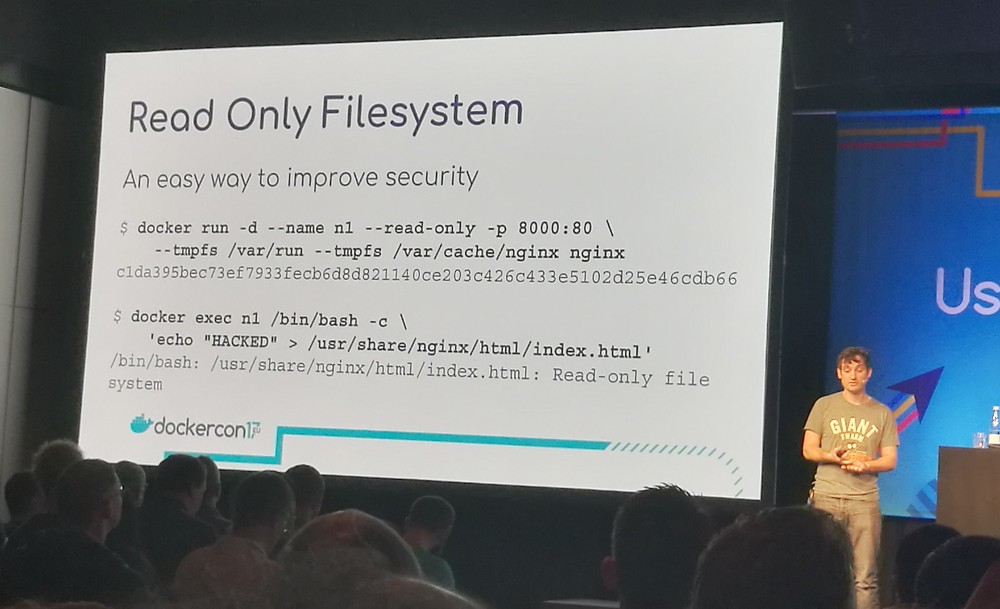
To improve security, use a read-only file system by adding
--read-only to the run command. Use a
tmpfs mount to
create writeable locations where applications can write e.g. pid
files. The data written to the tmpfs mounts is kept in memory and not
stored persistently on the host.
Users are not namespaced (by default). If an attacker breaks out of
the container via service running as root, the attacker is also root
on the host. So do not run as root! Create and set a USER in your
Dockerfile or use the nobody user.
It’s nearly always a bad idea to run Docker in Docker (issues with
file systems and caching, image stores). Instead, mount the Docker
socket with “-v /var/run/docker.sock:/var/run/docker.sock”. Be
aware: this is a security problem because there is less isolation
between the container and the host.
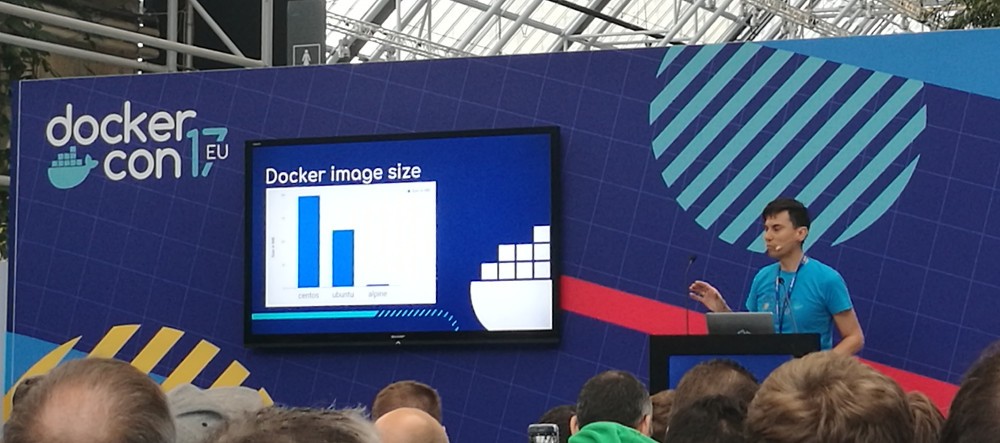
Alpine Linux under the microscope — Natanael Copa (Docker)
Alpine Linux uses the MIT licensed musl
libc which has a clean, modern codebase and is lightweight. It’s
small, so what is missing?
Some GNU extensions
Lots of localization data
GNU bloat
Name Service Switch (NSS)
Network Services Library (libnsl)
80+ CVEs ;-)
Natanael Copa comparing the sizes of CentOS, Ubuntu and Alpine Linux Docker images
Busybox is also part of Alpine Linux. It includes most of POSIX’s
shells and utilities. It’s pretty impressive how many tools are
squeezed into ~800KB.
Alpine created apk-tools because the traditional package managers were
not fast enough. It is faster than other package managers because it
is designed to read once and write once (compared to minimal 3 reads and 2
writes).
The --no-cache option was added to the package manager specifically
for Docker. It does not store cache information on disk. If you use
this flag, you do not need a cleanup step (in contrast to when you are
using apt).
With regards to security:
Alpine uses secure defaults
Has a smaller attack surface
Uses more secure components (musl, libressl)
Has a hardened kernel (unofficial fork of grsecurity)
When not to use Alpine? If you:
Depend on precompiled (closed source) binaries
Need good localization
Want commercial support
Need glibc/GNU specific behaviour
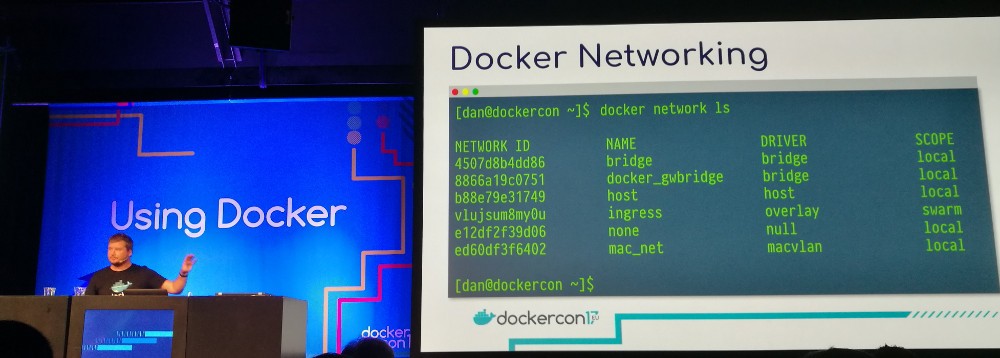
Practical design patterns in Docker networking — Dan Finneran (Docker)
Several types of network drivers:
Null: you can use this to black hole your container.
Host: simplest, come out of the box (use
--net=host). The container will connect its ports to the host.
Bridge: no flags needed (the default), connect to the
internal bridge network. Containers can speak with each other, but
nothing can speak with them or the other way around.
Using the -p flag you can expose ports. Only expose services
that need to be exposed.
Swarm overlay networking: using VXLAN to create overlay network over
the underlying network. The network is encrypted by default.
A relatively new addition is the macvlan driver. It provides a
hardware address to each container. You’ll want this if you need to
connect to a VLAN network or have to deal with IPAM. It requires
promiscuous mode.
The macvlan driver essentially makes a Docker container a first
class citizen on the network.
You can have a separate data and control plane in your network on
hosts with multiple NICs. This provides physical and logical
separation of traffic.
]]><![CDATA[DockerCon EU 2017: day one]]>https://markvanlent.dev/2017/10/17/dockercon-eu-2017-day-one/2021-10-08T19:02:07Z2017-10-17T00:00:00ZThese are my notes of my first day at DockerCon.
Where I usually try to make summaries of conference talks I attend,
I’ve only made notes for this conference. Most, if not all, talks have
been recorded as far as I know, so you should be able to watch them to
place the notes into context.
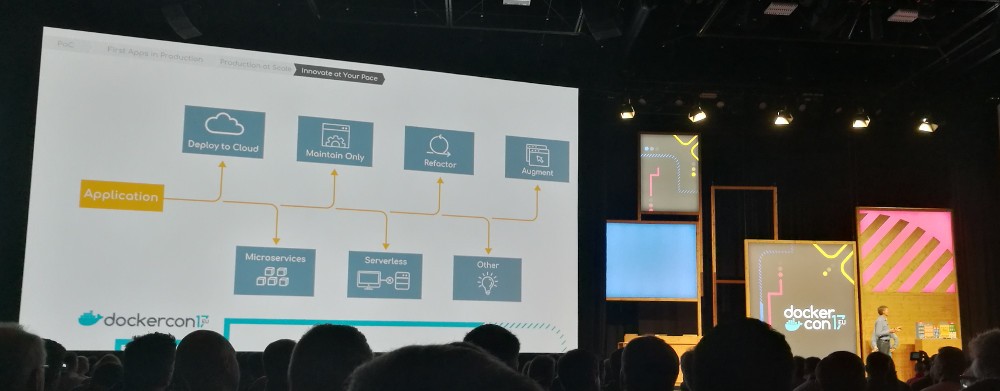
General session
In the context of “MTA” (modernize traditional applications) we saw a
demo of how easy it is to convert legacy applications with the Docker
application converter (dac). In the demo they showed how the tool can
generate a Dockerfile from a tarball of a Java application.
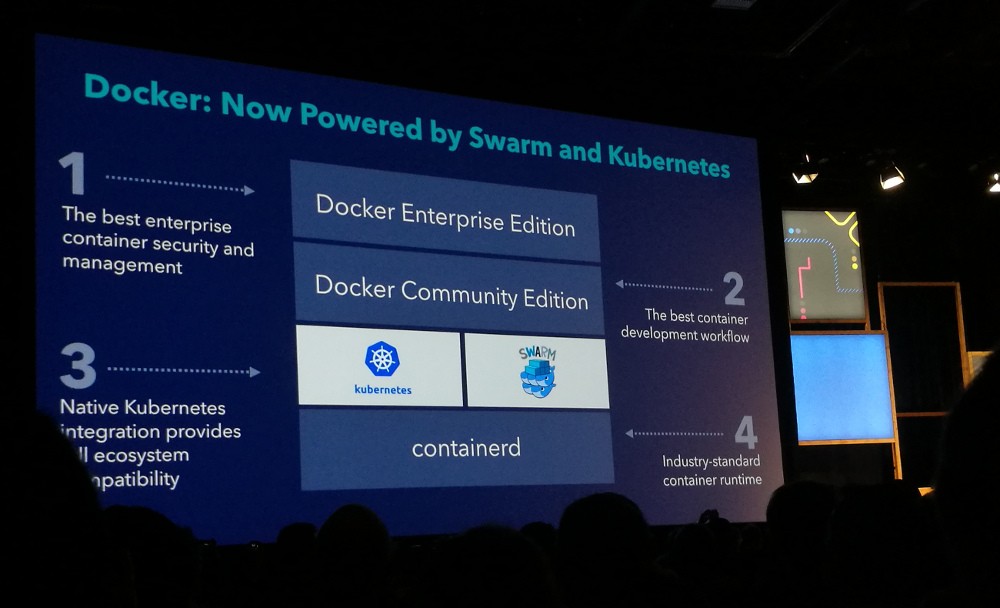
Not everyone is using Swarm. Unfortunately, using a different
orchestration tool means that you do not have the seamless integration
that Swarm has. However, the next version of Docker will have native
integration for both Swarm and Kubernetes.1
This way you can still use the same tools and workflow while being
able to choose between Swarm and Kubernetes. It also means you can
still use your docker-compose.yml files.
Hacked! Run time security for containers — Gianluca Borello (Sysdig)
A container is ephemeral and you don’t need to protect it. You want
to protect the application/service instead.
SELinux is very powerful, but difficult to master. And thus people
often turn it off. To avoid users turning off or circumventing
security measures, one should reduce friction.
Forensics on containers is difficult, for instance because containers
may only live for a few minutes.
To build a security framework, you need to:
observe, e.g. using Sysdig
understand the services, e.g. using Sysdig ServiceVision
Gianluca demonstrated that Falco can detect e.g. network activity
performed by known binaries that are not supposed to send or receive
data over the network.
Sysdig maintains a ruleset for Falco. They update it weekly. They are
also experimenting with automatic ruleset creation based on normal
behaviour of a container.
Sysdig Secure: A new product to
provide run-time security for containers. You can define policies when
to trigger an event. You can also store Sysdig captures so that you
can see what happened before the event triggered.
Sysdig Inspect is a UI
around open source Sysdig tool to analyse Sysdig captures.
Sysdig has a low overhead (different from strace). It is meant to run
24/7 on production systems.
Docker?!?! But I’m a SysAdmin — Mike Coleman (Docker)
There was a contest to create the smallest Docker container that
printed out “Hello world”. The result was an image of only 64
kilobyte.
Security is about more than just isolation. For instance: where did
the images come from, are they up to date, how do you deal with
sensitive data and/or passwords?
Docker for AWS and Docker for Azure have integration for those platforms. They
offer more than installing standard Docker on an EC2 instance.
When you start integrating Docker into your environment, don’t forget
to change your processes. Think about your backup and recovery
strategies, et cetera.
Mike encourages us to share our knowledge, and our missteps.
Creating effective images — Abby Fuller (AWS)
This is a talk about disk space.
Smaller images mean faster builds and deploys, but also a smaller
attack surface.
Some tips:
Use shared base image where possible.
Limit the data written to the container layer.
Chain RUN statements.
Prevent cache misses at build for as long a possible.
To prevent cache misses, put all static stuff first (labels, etc). You
really want to make sure that you use the cache as much as possible.
docker system prune -a: Also remove untagged volumes, etc.
Make sure your orchestration platform is garbage collecting.
Recap:
Less layers is more
Choose or build your base wisely
Not all languages should build the same
Keep it simple, avoid extras (e.g. use apt install --no-install-recommends)
Tools are here to help
Docker 500: Going fast while protecting data – Diogo Mónica (Docker)
Security means a state of being free from danger or threat. But as
soon as we connect something to a network, we are exposing it to
threats. So it would be better to talk about “safety” since that is
about being protected from or unlikely to cause danger, risk or
injury.
The “Docker 500” from the title is a play on the Indy 500
While there can be horrible accidents in the Indy 500, the drivers
often can just walk away from their car. We must architect our systems
to protect our data, just like the drivers are protected in the Indy
500.
In racing, two categories of measures are taken: before the crash and
after/during the crash.
If we translate the pre-crash measures to our world, we’d get
something like this:
Test: create a trusted, repeatable and adversarial CI/CD
pipeline. Unless you have adversarial tests, you are effectively
testing in production.
Design applications to segment portions of their infrastructure
(microsegmentation).
Practice worst case scenarios. For example: if a secret (key) is
leaked, can you revoke trust of that secret in under X time?
Reverse uptime! Have a maximum uptime for a server. Note that this
is also good for operations because the machines don’t get a
chance to drift.
Measures after/during a crash:
Freeze the container (disk and memory state), solve the problem
and inspect the frozen container later.
Automatic scaling.
Sandbox by default (by putting it in Docker). Make sure that data
cannot be operated outside your data center by so called
“crypto-anchors” (a term coined by Diogo) via e.g. a hardware
security module.
Role based access control + visibility
Have data about the crash. This is where the Docker security
ecosystem shines.
Access to the data should not just be secure, but also safe. With careful
engineering you can be fast and safe at the same time.
Note that containerd can freeze memory and push to a registry. For
freezing the disk you can use commit and then push to a registry.
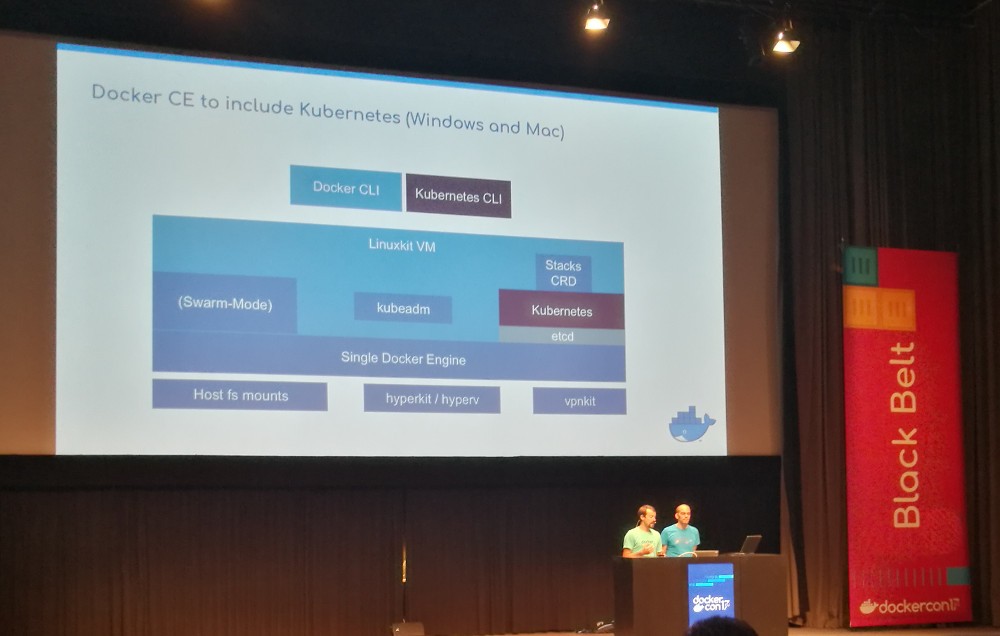
Update 2017-10-19: I now understand that Docker CE will only
include Kubernetes in Docker for Windows and Docker for Mac because
those platforms use LinuxKit. Docker (the company) is not clear on
how/when Kubernetes will be supported on Linux. ↩︎
]]><![CDATA[DevOpsDays Amsterdam 2017: day zero (workshops)]]>https://markvanlent.dev/2017/06/28/devopsdays-amsterdam-2017-day-zero-workshops/2021-10-07T18:13:55Z2017-06-28T00:00:00ZBefore the regular DevOpsDays kicked off, there was a day filled with workshops.
Before we got started
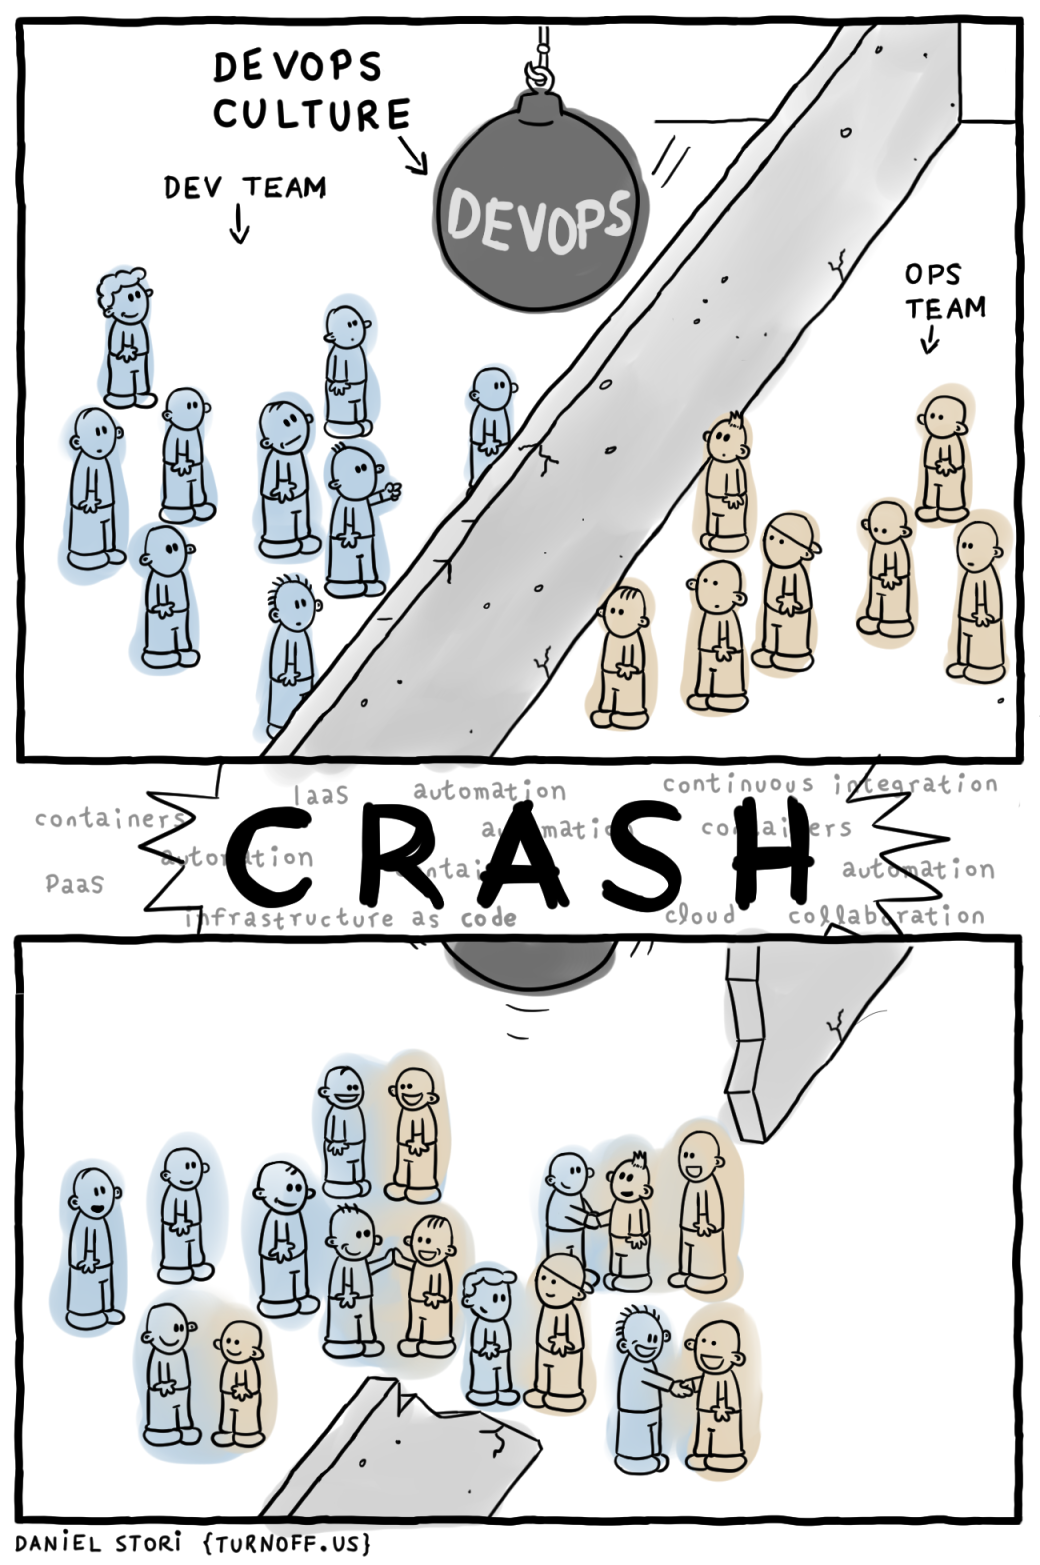
While I was on my way to Amsterdam, I was reading up on my RSS feeds
and ran across the most recent comic on
turnoff.us. It was so appropriate that I decided
to copy it here:
Setup your own Ansible/Docker Workshop/Raising an Ansible Army — Arnab Sinha (TATA Consultancy Services)
Arnab wanted to be able to easily create lab environments for
trainings. This workshop not only discusses how the lab is setup but
also uses such a lab environment (in this case to provide an Ansible
training environment).
The nature of the setup of the lab he used today: each participant got
a control node and two managed nodes. Each node was in fact a Docker
container which was managed by Ansible.
The first part of the workshop was basically an introduction to
Ansible with topics like the history of Ansible and basic command line
usage. Arnab demonstrated how to use a custom inventory file, limiting
plays to a group or certain tasks (or skipping tasks) and how to syntax
check your playbook.
A few examples:
$ ansible all -i "localhost," -c local -m shell -a whoami
$ ansible -i demo.ini all -m shell -a whoami -v
$ ansible-playbook playbook.yml --syntax-check
Some best practices:
Use the .ini extension for your inventory file.
Use a separate inventory file for each environment (develop, test,
production, etc).
Use tags so you can specify which tasks you want to run. (Use
“ansible-playbook --list-tags playbook.yml” to show all available
tags.)
In the category “today I learned”:
Ansible has a pull mode (ansible-pull). Who knew? :-)
Ansible comes with documentation: ansible-doc.
Looping over sequences with with_sequence (see
the docs).
You can make a playbook executable by adding
#!/usr/bin/env ansible-playbook
at the top (and using chmod).
If you want to run your own lab, you can use Arnab’s GitHub repo:
arnabsinha4u/ansible-traininglab. Note
that this assumes a CentOS host.
In order to be able to log in to the “master” node (via ssh ansiblelabuser1@localhost) I had to enable PasswordAuthentication
in /etc/ssh/sshd_config. But since I had run the Ansible playbook
already, I was not allowed to change that file. I first had to run
this command:
Introduction To Kubernetes — Andy Repton (Schuberg Philis)
Kubernetes is a container orchestration platform. It has a huge open
source backing and new features are being built quickly. It does one
thing (in an elegant way).
Kubernetes has three main components:
Masters: the brains of the cluster. Consists of: Apiserver,
controller manager, scheduler.
Nodes: the brains of individual nodes. Consists of: kubelet,
kube proxy.
etcd: replicated key/value store; the state store and clustering
manager of kubernetes.
When you look at it from a ‘physical’ perspective, you have a
Kubernetes node and this node runs Docker, which in turn runs the
containers. Pods are a logical wrapper around containers; we don’t care
about nodes.
Pods are mortal. What this means is that processes are expected to
die. But we do not care because Kubernetes ensures availability by
making sure that there are enough of them running.
The pod you can create with the pod/pod.yml file can be used for a
toolbox to examine other pods.
More terminology: a replica set is basically a way of saying “make
sure there are N copies of a pod.” If you look at the specification of
a replica set, you can see that it contains a Pod spec.
Using the readinessProbe directive you can make sure that a
container does not receive traffic until it is actually ready. Note
that this is different from Docker’s health check which is meant to
determine if a container is still working or should be killed.
With the replica set example in aforementioned repo, Kubernetes will
automatically start a pod again if it is killed. Even if you kill a
pod yourself—Kubernetes doesn’t care why it has gone down.
If you edit a replica set (e.g. to update to a newer version of an image),
it has no immediate impact because the pod spec is nested. Deployments
can enforce changes are being executed though.
To get the whole configuration of a pod, including the default and not
just the stuff we specified, run:
$ kubectl get pod <podname> -o yaml
Note that volumeMounts appear by default on every pod you create.
Secrets, although the name implies something different, are not
encrypted; all pods in the same namespace can access the secret and
decode it (base64). It is an easy way to put information in a pod, it
is not secure!
Services don’t “exist” like containers do. A service is a purely
logical idea. A service exposes pods to other pods.
A service automatically gets a DNS entry: <service name>.<namespace name>. This means that from inside your containers, you can use DNS
to access other containers.
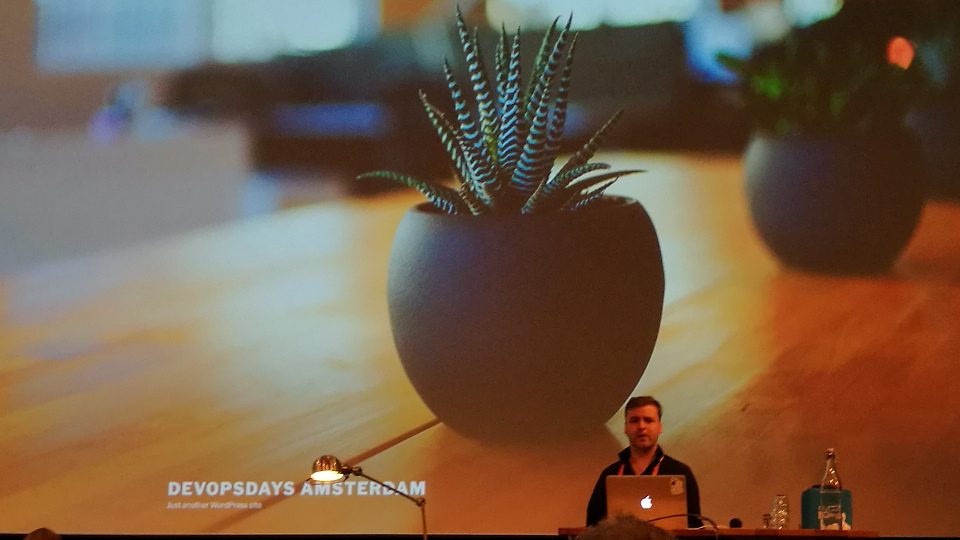
Andy with his fresh WordPress installation
About scheduling:
You can label nodes and then make sure that pods are scheduled on
nodes with a certain label.
Kubernetes will distribute pods across nodes as ‘evenly’ as
possible.
Kubernetes will not auto reschedule pods when you add a new node.
For this workshop we used kops
because it was easier. At Schuberg Philis they actually use Terraform
to manage their cluster(s). Note that you can use a flag and then
kops will spit out Terraform code.
If you are worried about your pods going down gracefully,
you are doing your pods wrong.
If your application depends on long running processes: don’t use
Kubernetes. Use the right tool for the right application.
Combine containers inside pods if latency matters, if they need to
share configuration files or if they need to connect via loopback
device.
Miscellaneous:
Kompose: a tool to convert Docker Compose
files to Kubernetes YAML files.
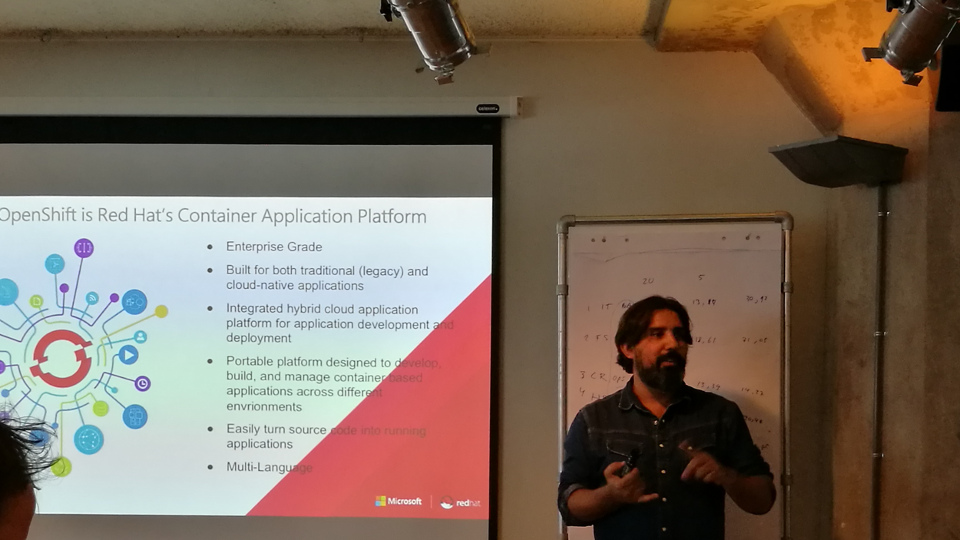
Hands-On OpenShift Developer Workshop (In Azure) — Alessandro Vozza (Microsoft) & Samuel Terburg (Red Hat)
Why OpenShift: because developers need a platform to be able to deploy
their applications. OpenShift is a platform to run your containers at
scale. Meant for enterprise: not necessarily the latest features, but
focus on stability.
OpenShift was originally written in Ruby, but it has been rewritten in
Go and it is built upon Kubernetes. Openshift is always one release
(circa three months) behind on Kubernetes.
Everything you can deploy in Kubernetes, you can deploy on OpenShift.
Alessandro explaining what OpenShift is
OpenShift Origin is community
supported. If you want a commercially supported version, you have to
run on Red Hat Enterprise Linux
(RHEL). Red Hat OpenShift uses RHEL
images, where OpenShift Origin uses CentOS.
OpenShift Online runs on AWS, but you can for instance also run it on
bare metal if you want. But public clouds are a more natural fit for
cloud-native applications.
Pods are the orchestrated units in OpenShift. Containers in a pod can
talk to each other via localhost and local sockets. The security
boundary is extended from the container to the pod. Containers can see
each others processes and files. You only want to run one process in a
container though.
A service can be seen as a sort of load balancer to redirect traffic to
the right pods. Internally it is using iptables.
OpenShift provides its own Docker registry which you can use if you
want to.
OpenShift has solved the persistent storage problem before Kubernetes
did. You can use the native storage for your solution (e.g. EBS for
AWS). Note that block storage solutions require mounting/unmounting
and thus takes a little longer.
As with Kubernetes, there is no built-in autoscale for OpenShift.
Red Hat CloudForms
can monitor your cluster and do the scaling for you.
The routing layer is your entrypoint into the cluster. It’s based on
HAProxy. Comparable with Kubernetes' Ingress.
RHEL Atomic is a minimalistic OS designed to run Docker
containers. (It is similar to CoreOS, but Red Hat wanted to have its
own OS.) Everything you want to run has to run in a container. You can
install OpenShift on RHEL Atomic.
Fun fact: you can create resources in Azure with Ansible.
Unfortunately there were some problems with the Red Hat OpenShift
Azure Test Drive. As an alternative I used
minishift to
run OpenShift on my laptop. With it, I could work on the workshop.
]]><![CDATA[Setting up a temporary HTTP/HTTPS proxy via SSH]]>https://markvanlent.dev/2013/09/19/setting-up-a-temporary-http-https-proxy-via-ssh/2022-05-10T20:18:22Z2013-09-19T06:32:00ZCurrently I’m working on a project where I have the staging
environment running on a virtual machine in a vlan. However, the
virtual machine cannot directly access the internet for security
reasons. This is inconvenient when I want to e.g. run a
buildout to update the project.
A colleague told me to use
micro_proxy and
micro_inetd to proxy
traffic via my laptop. This is a description of how you can set things up.
Update (2019-07-15):
I am currently using a Docker to run a proxy on my
laptop. I have added a Docker section where I describe my new
setup.
Ad hoc
Obviously the first step is to install the relevant packages on the
local machine (Ubuntu in my case):
$ sudo apt-get install micro-proxy micro-inetd
The next step is to run the proxy (again: on my laptop) and make sure
it accepts connections on port 3128:
$ micro-inetd 3128 /usr/sbin/micro_proxy
Then, when you SSH into the remote machine you will have to forward
the right port:
$ ssh box.example.com -R 3128:localhost:3128
Whenever you want to access the internet, you’ll have to use the proxy
listening on port 3128. For instance to run wget and buildout,
you can set the following environment variables:
(Note that I’m also proxying HTTPS traffic here, which is supported by
micro_proxy.)
The following wget command should now succeed:
$ wget http://www.google.com/
Repeatable
Assuming the ad hoc setup works, you may want to configure things so
things are a little bit easier the next time you want to use it. This
is what I did.
So I don’t have to remember how to start the proxy, I added this line
to the ~/.bashrc file on my local machine:
aliasstart_proxy='echo Running proxy on port 3128 && micro-inetd 3128 /usr/sbin/micro_proxy'
The SSH command is also too much typing for my liking. So I added this
to my ~/.ssh/config file:
So whenever I want to work on the staging environment, I open a
terminal and run:
$ start_proxy
In another terminal I type:
$ ssh box
And I’m good to go.
Now, there may be better solutions (especially if you want to
permanently setup a proxy), but for my purposes this works great.
Docker
Update (2019-07-15):
I’ve added this section to document an alternative to the
micro_inetd/micro_proxy combination.
When I originally wrote this article, I was not yet (or only just) using Docker.
But when I was setting up a new laptop a while ago, I wanted to run a proxy in a
Docker container.
As a result, I now run the following to start a proxy:
$ docker run --name squid -d -p 3128:3128 datadog/squid
This way I don’t have to install micro_proxy and micro_inetd on my machine.