Keynote: The Rise of the Supply Chain Attack — Sean Wright
Dependency managers (like Apache Maven) changed the way software is being developed: using those makes it much easier to use dependencies in your application (you don’t have to fetch them manually yourself). As a result, building your own libraries is now less common, using an available (open source) library is much easier.
To get a feel for the scale: NPM serves 2.1 trillion annual downloads (requests). This obviously includes automatic builds, but the growth over the last couple of years has been exponential none the less. And using third party libraries can be a very good thing. Good libraries can be much more secure and have less bugs than some library developed in house.
Types of supply chain attacks:
- Dependency confusion
- Register a private package (which you know is used by a company) in a public repository. If the package manager searches for the package in the public repository before the private one, the malicious package is used.
- Typo squatting / masquerading
- Use misspelled or “familiar” names in the hopes someone uses the wrong package.
- Malicious package
- Malicious payload in a package that promises (and perhaps even delivers) useful functionality.
- Malicious code injection
- Compromise of an existing package (e.g. by compromising the build system or repository).
- Account takeover
- Malicious actor can log in as the original author.
- Exploiting vulnerabilities in packages
- Using a known or unknown vulnerability in a library.
- Protestware
- For example a legitimate library with notes protesting against the war in Ukraine.
After this Sean unfortunately dropped from the session.
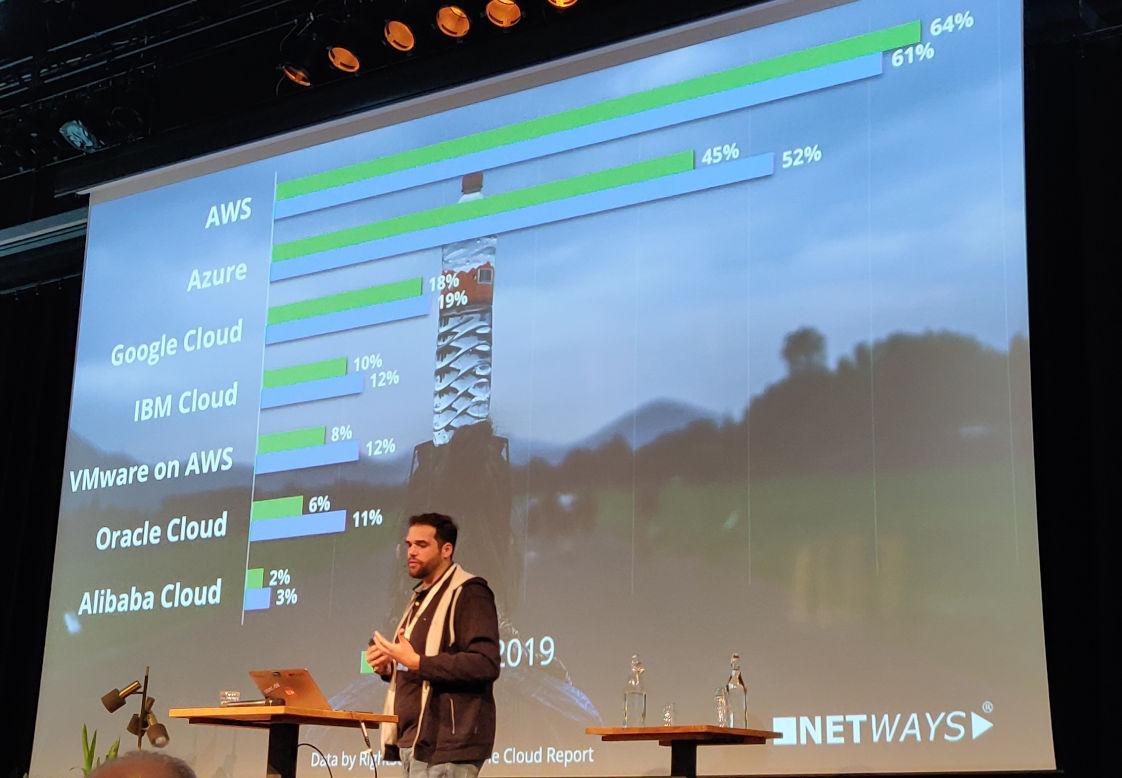
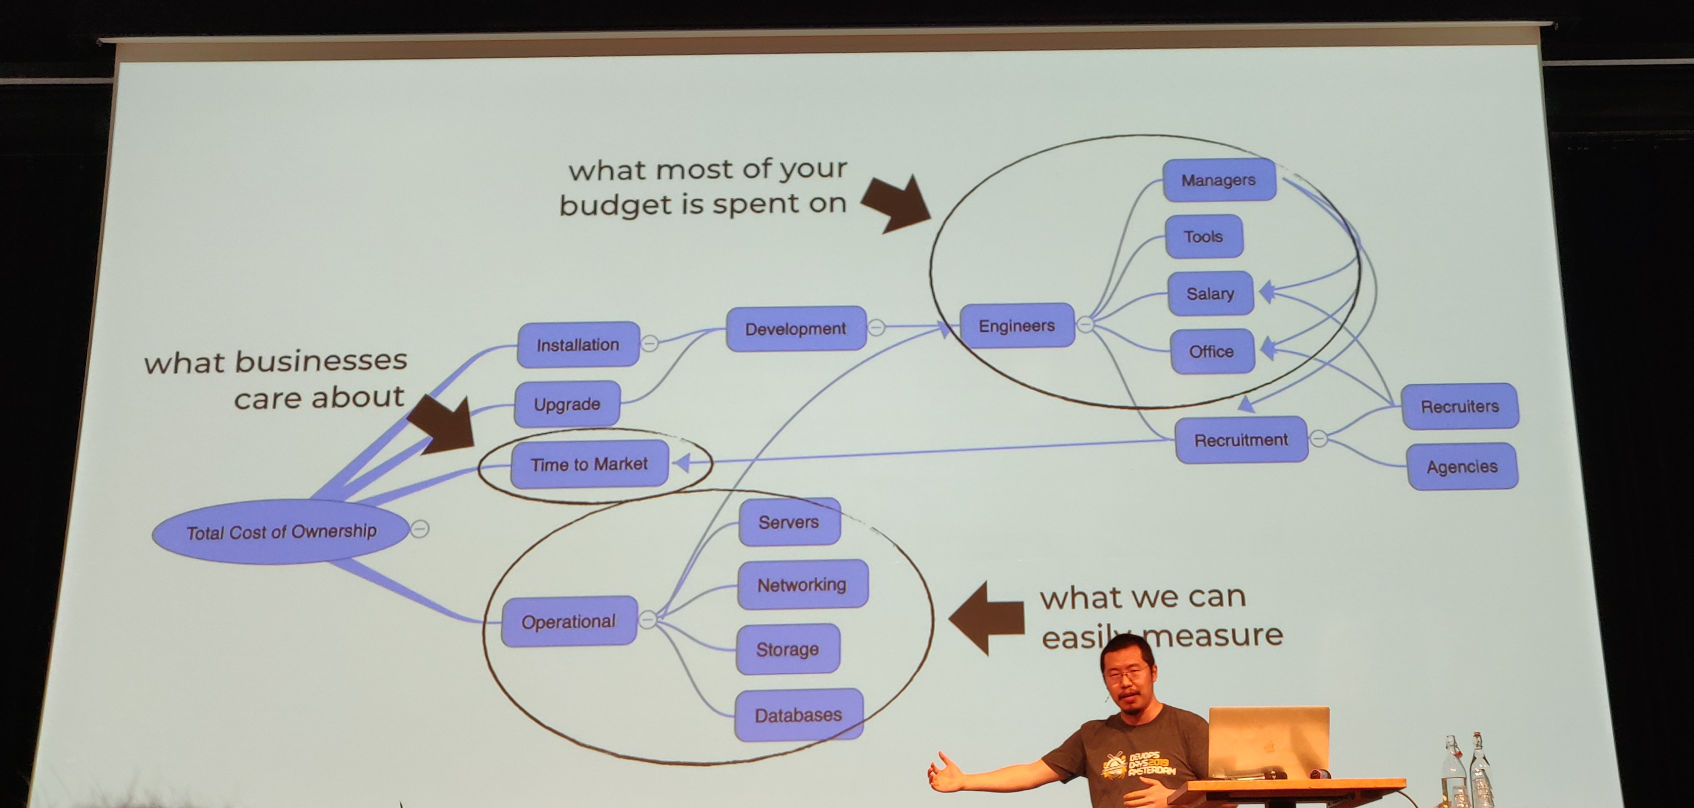
Taking Control Over Cloud Costs — Amir Shaked
Reasons to analyze your cloud costs:
- Costs translate to profit
- Usage is directly tied to costs (and if you don’t properly monitor, your spend could increase unexpected)
- Be in control: by monitoring you can determine what impact certain actions have on your business
- Be intelligent: by knowing what you spend where, you can connect it to your business KPIs
- Save money
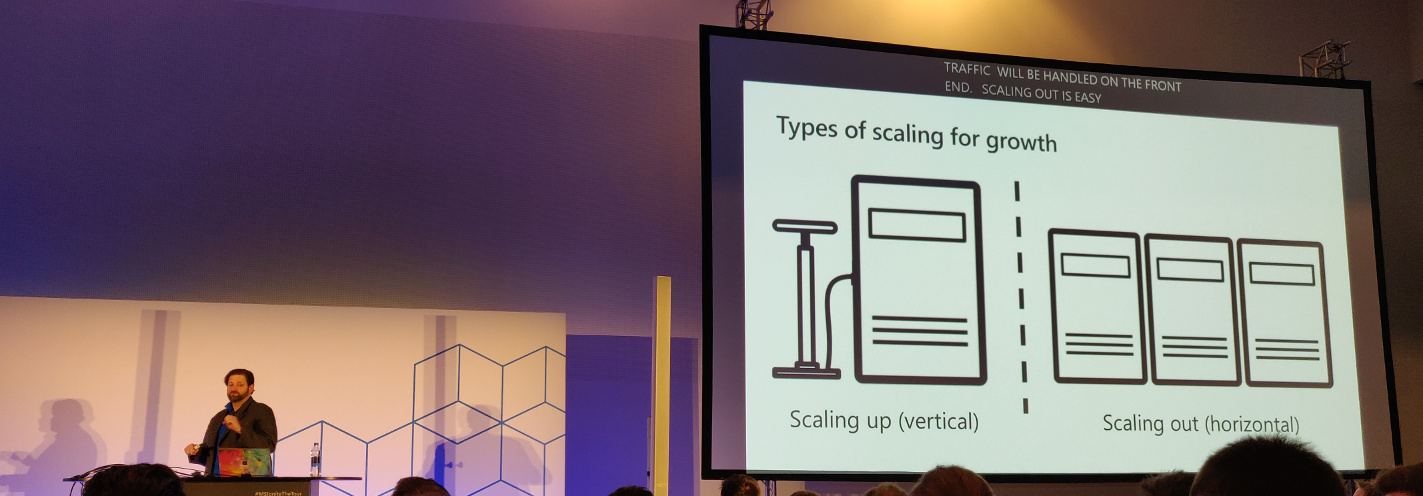
You’ll want to be aware when you scale (hyper growth) if your costs grow faster than the number of users/sales/etc. You don’t want to end up in a situation where more success means less profit.
Things to look for in your environment:
- Unused resources
- Over commitment
- Under commitment
- Price per unit we care about (e.g. users, sales, etc)
- Bugs
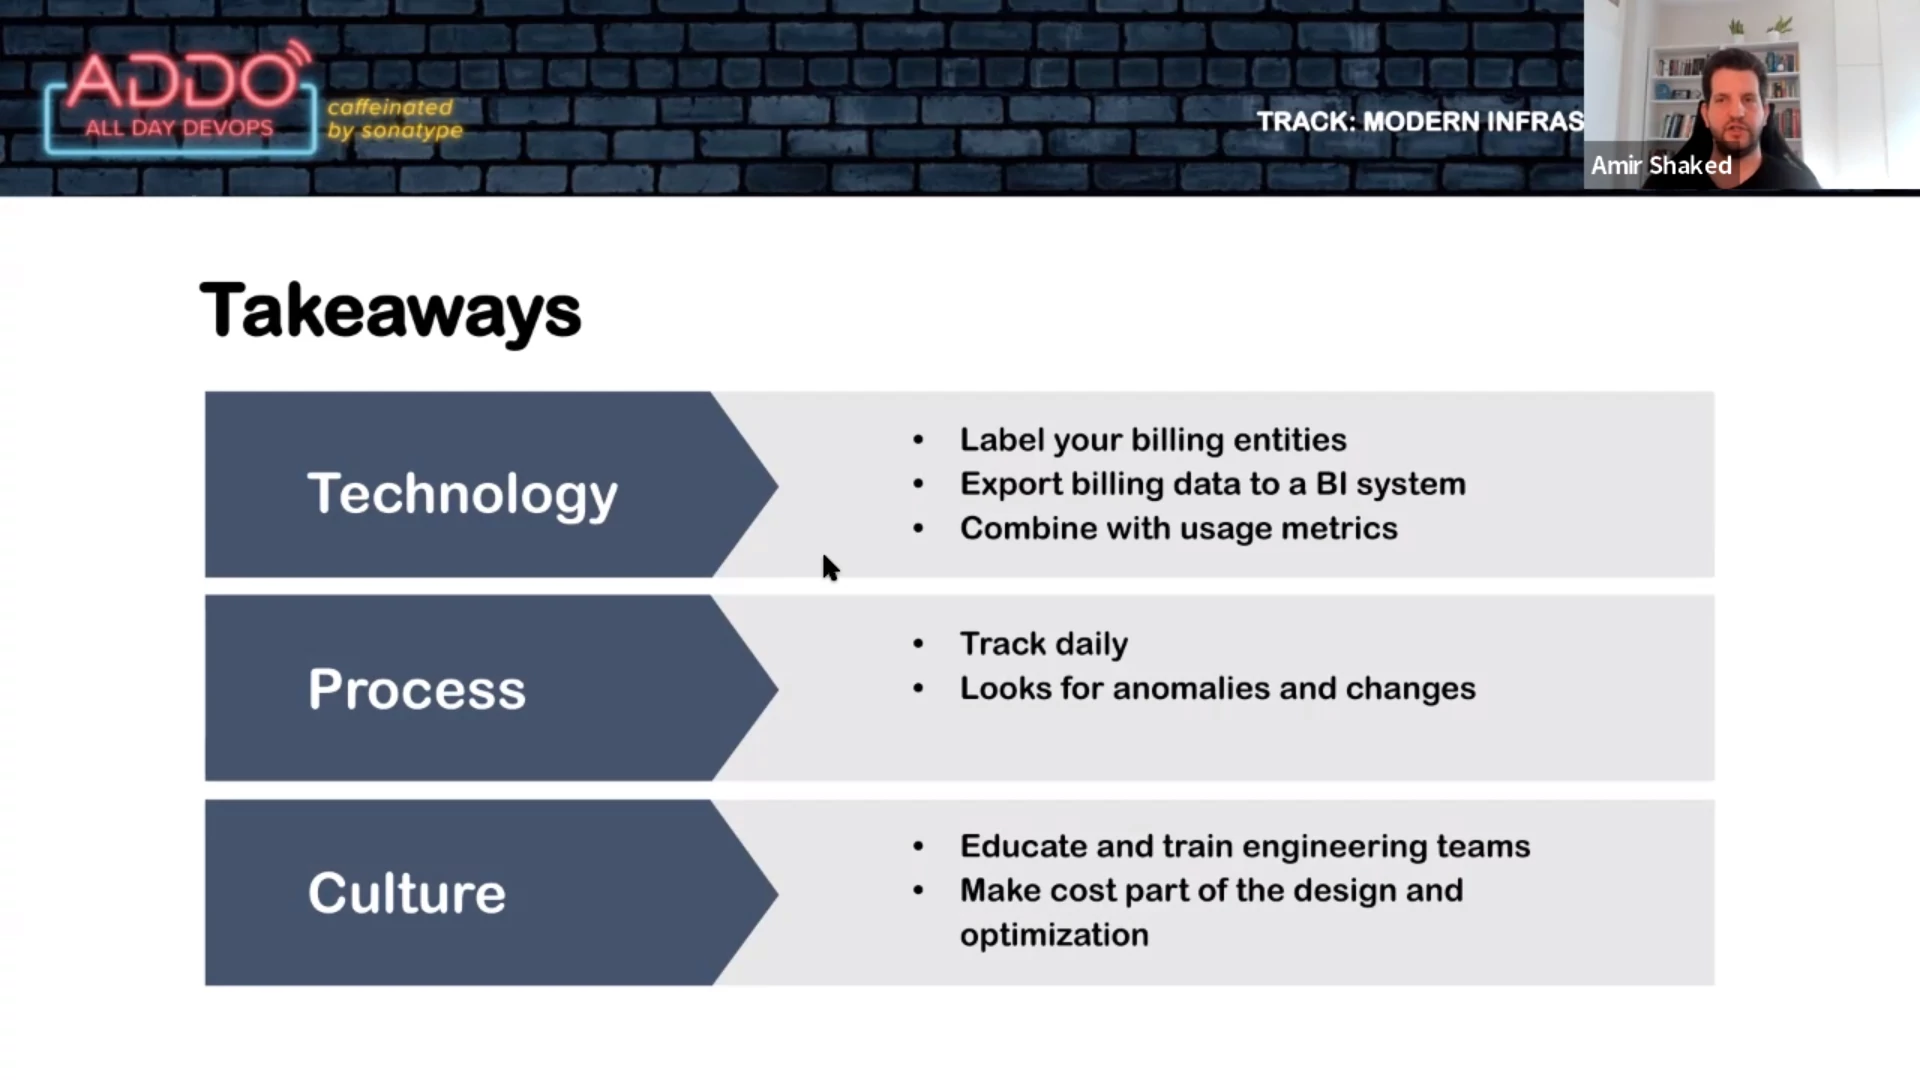
Best practices you can arrange from day one:
- Export billing data and create e.g. dashboards
- Structure and organize resources for fine-grained cost reporting
- Configure policies on who can spend and who has administrator permissions
- Have a culture of “showback” in your organization. Make your employees aware of the costs, have budgets and alerts.
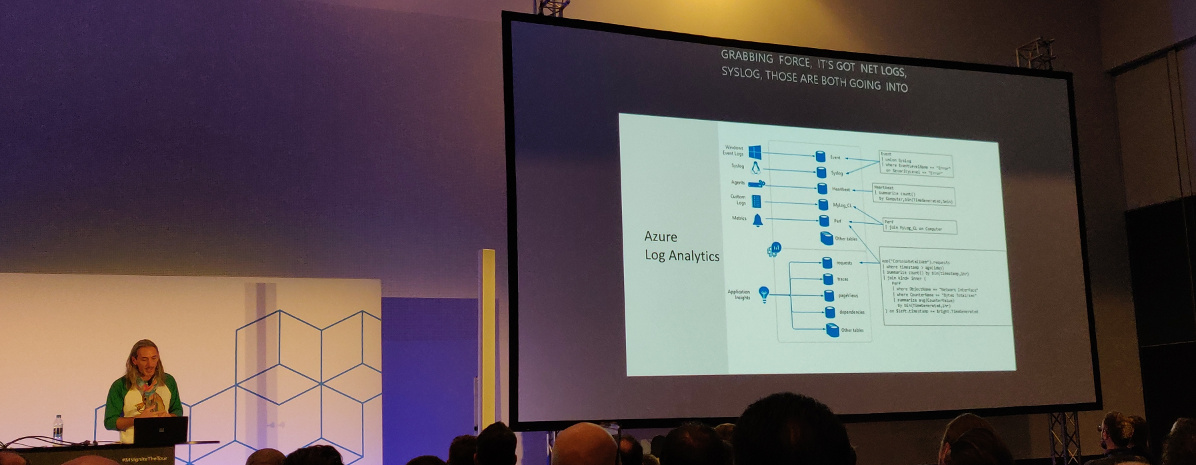
Beyond Monitoring: The Rise of Observability Platform — Sameer Paradkar
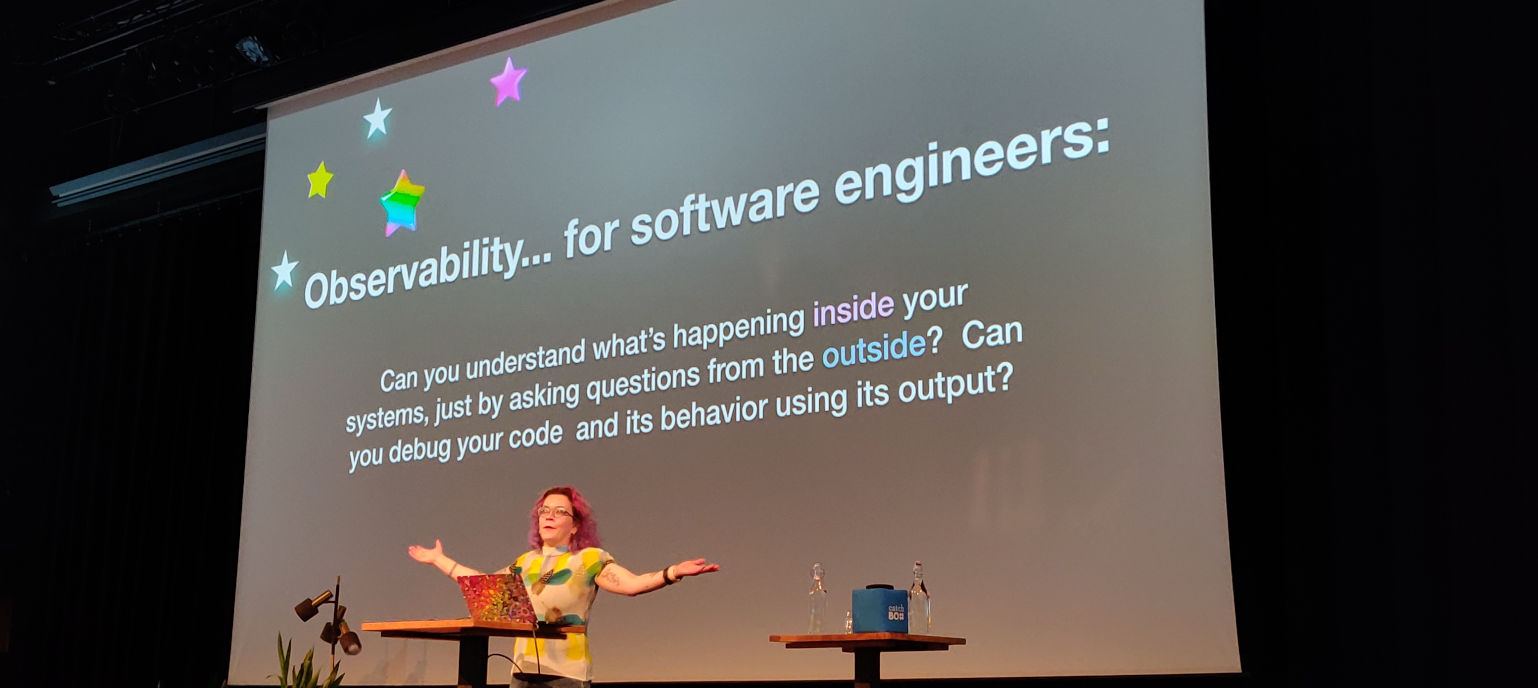
Customer experience is important for your revenue. You need to deliver your service and make sure you know how well you’re able to do so. Observability helps you find the needle in the haystack, identify the issue and respond before your customers are affected.
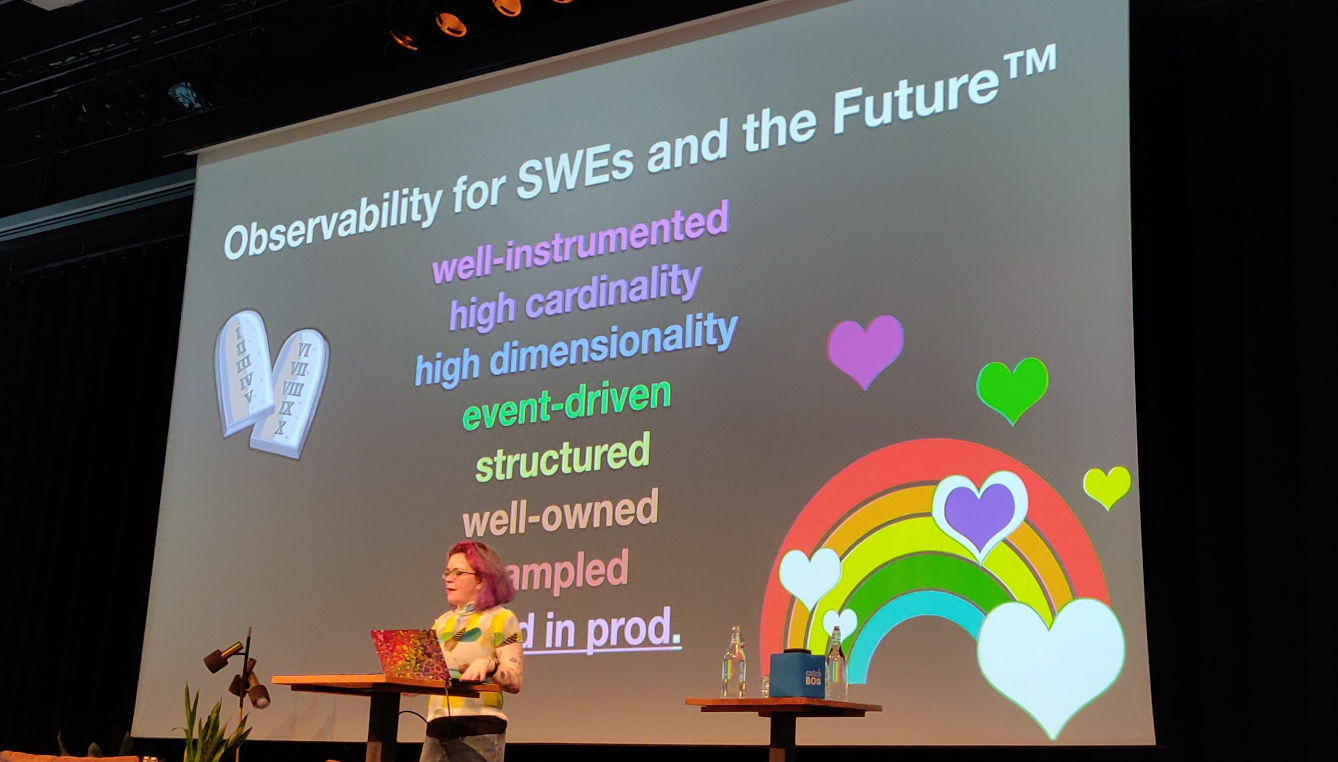
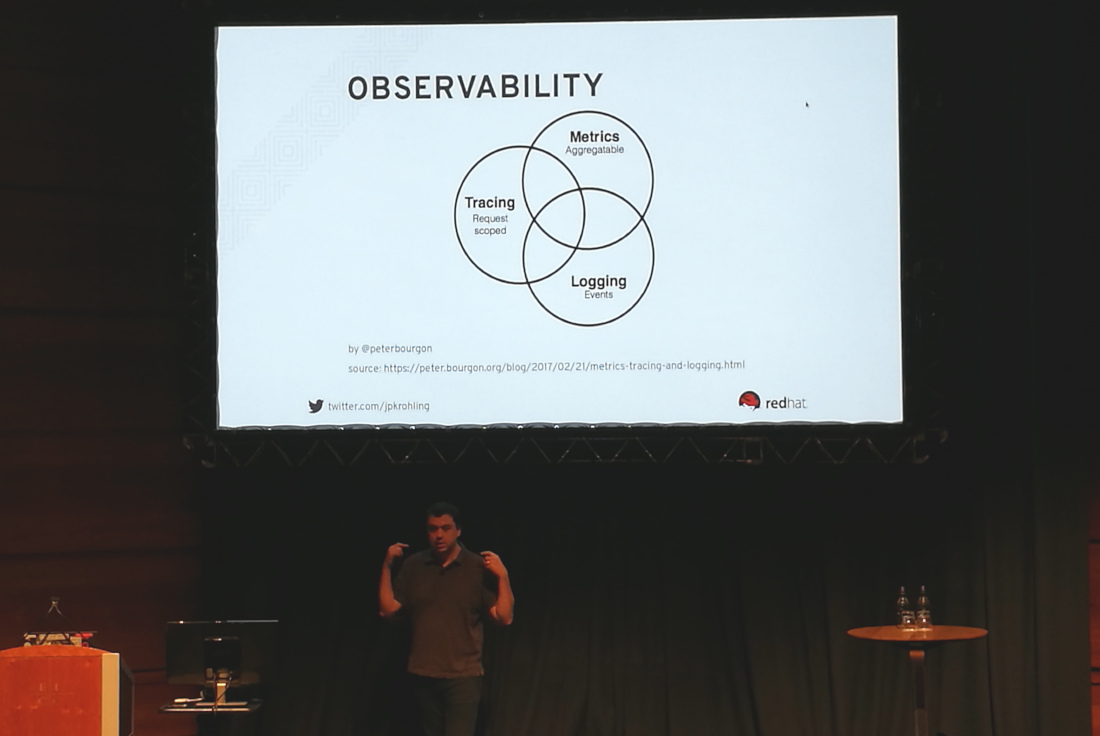
Pillars of observability:
- Metrics
- Numeric values measured over time. Easy to query and retained for longer periods.
- Logs
- Records of events that occurred at a particular time (plain text, binary, etc). Used to understand the system and what’s going on.
- Traces
- Represent the end-to-end journey of a user request through the subsystems of your architecture.
Relevant key performance indicators (KPIs) and key result areas (KRAs):
- Customer experience
- Mean time to repair (MTTR)
- Mean time between failure (MTBF)
- Reliability and availability
- Performance and scalability
An observability platform gives you more visibility into your systems health and performance. It allows you to discover unknown issues. As a result you’ll have fewer problems and blackouts. You can even catch issues in the build phase of the software development process. The platform helps understand and debug systems in production via the data you collected.
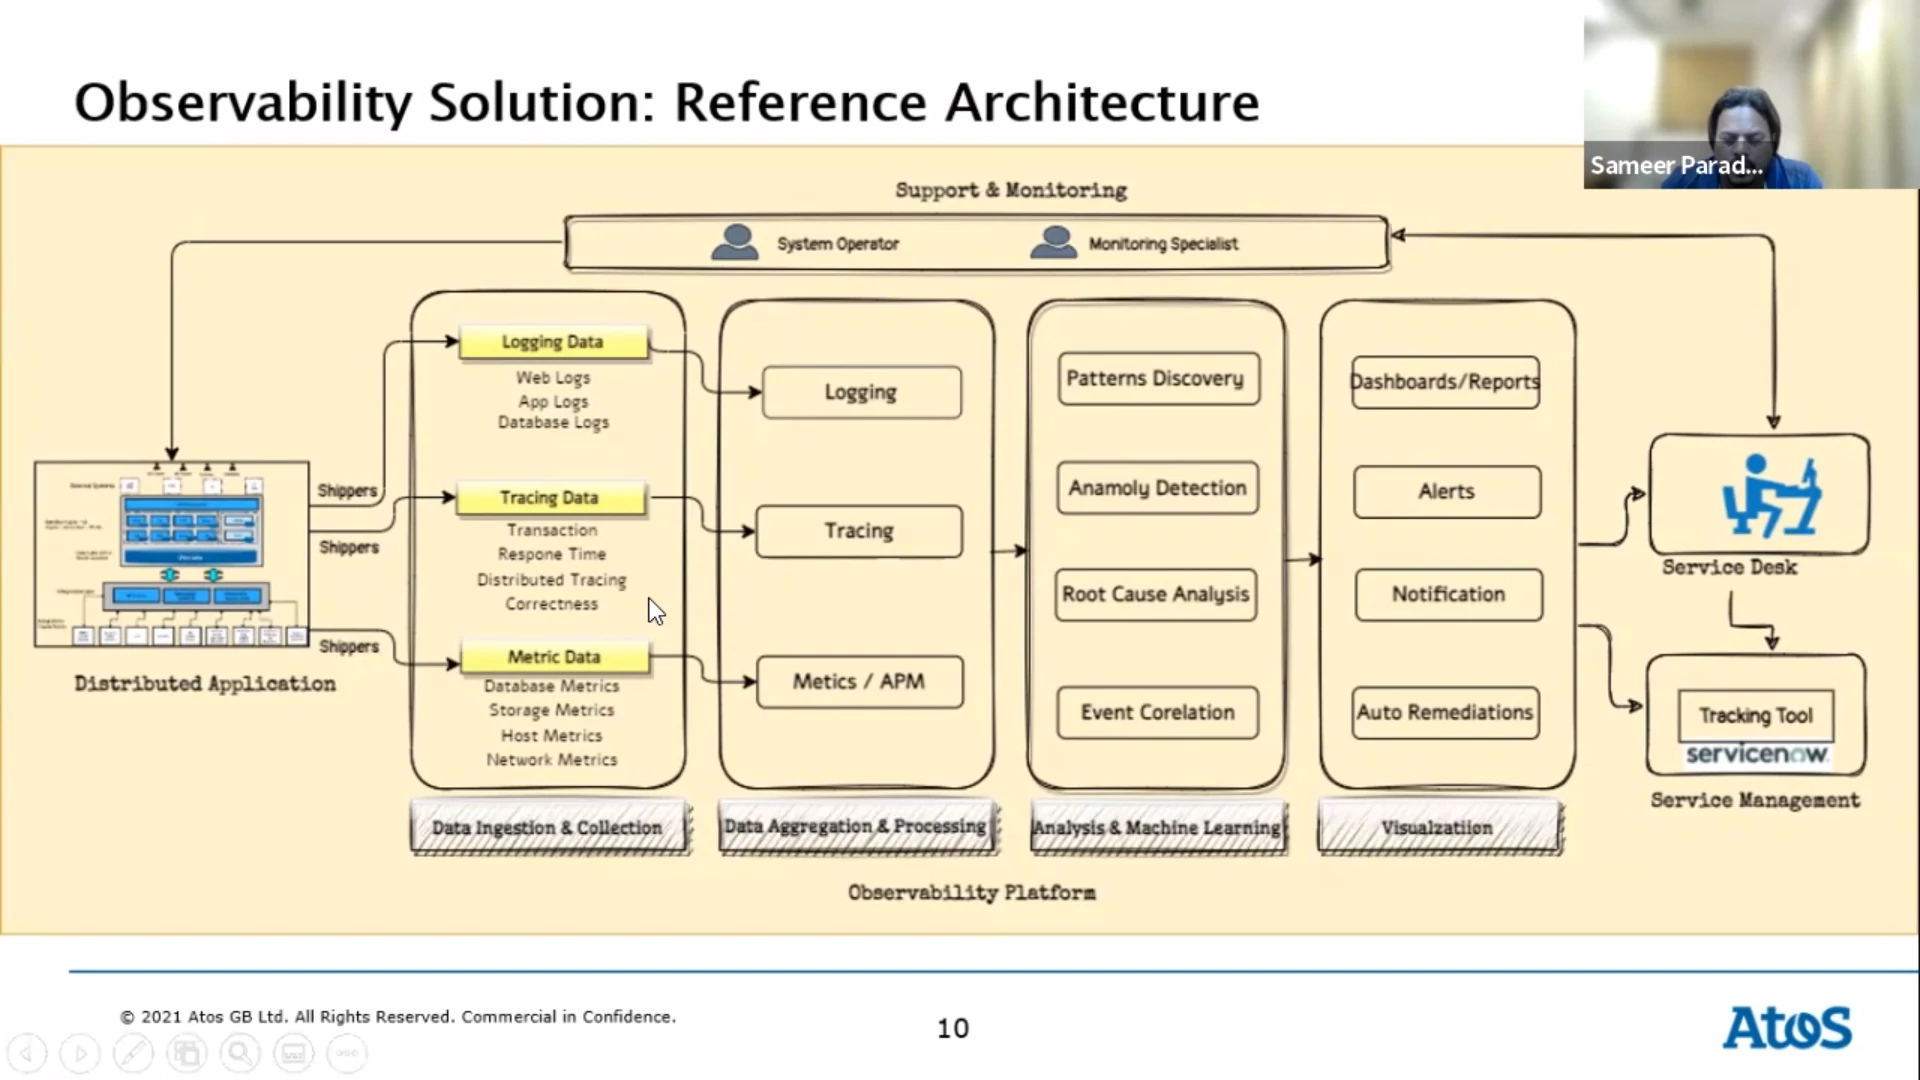
AIOps applies machine learning to the data you’ve collected. It’s a next stage of maturity. Its goal is to create a system with automated functions, freeing up engineers to work on other things. Automating remediation of issues can also greatly reduce response time and mean time to repair. This means that the customer experience is restored faster (or is never degraded to begin with).
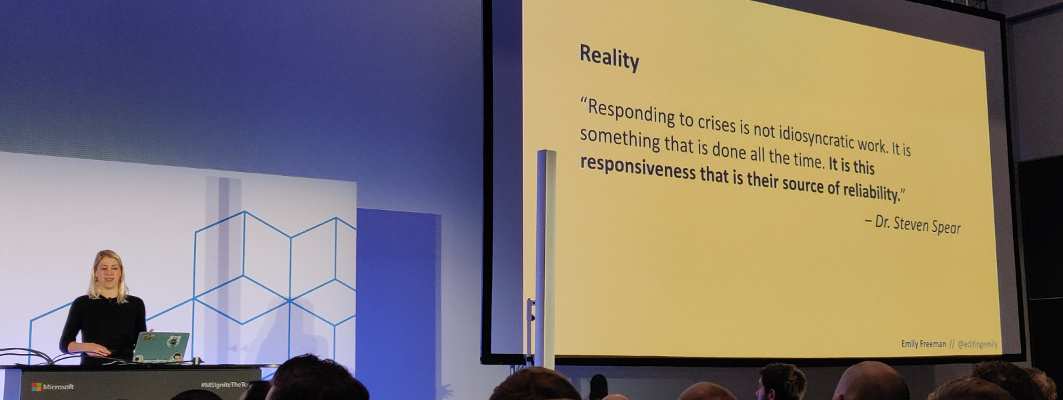
Failure Is Not an Option. It’s a Fact — Ixchel Ruiz
Failure can cause a deep emotional response, we can get depressed and it can make us physically sick. On one side of the spectrum, a failure can cause harm to other people. On the other side we could embrace failure and make things safe to fail. Failure in IT on the project level is quite common. Failure can also happen on a personal level.
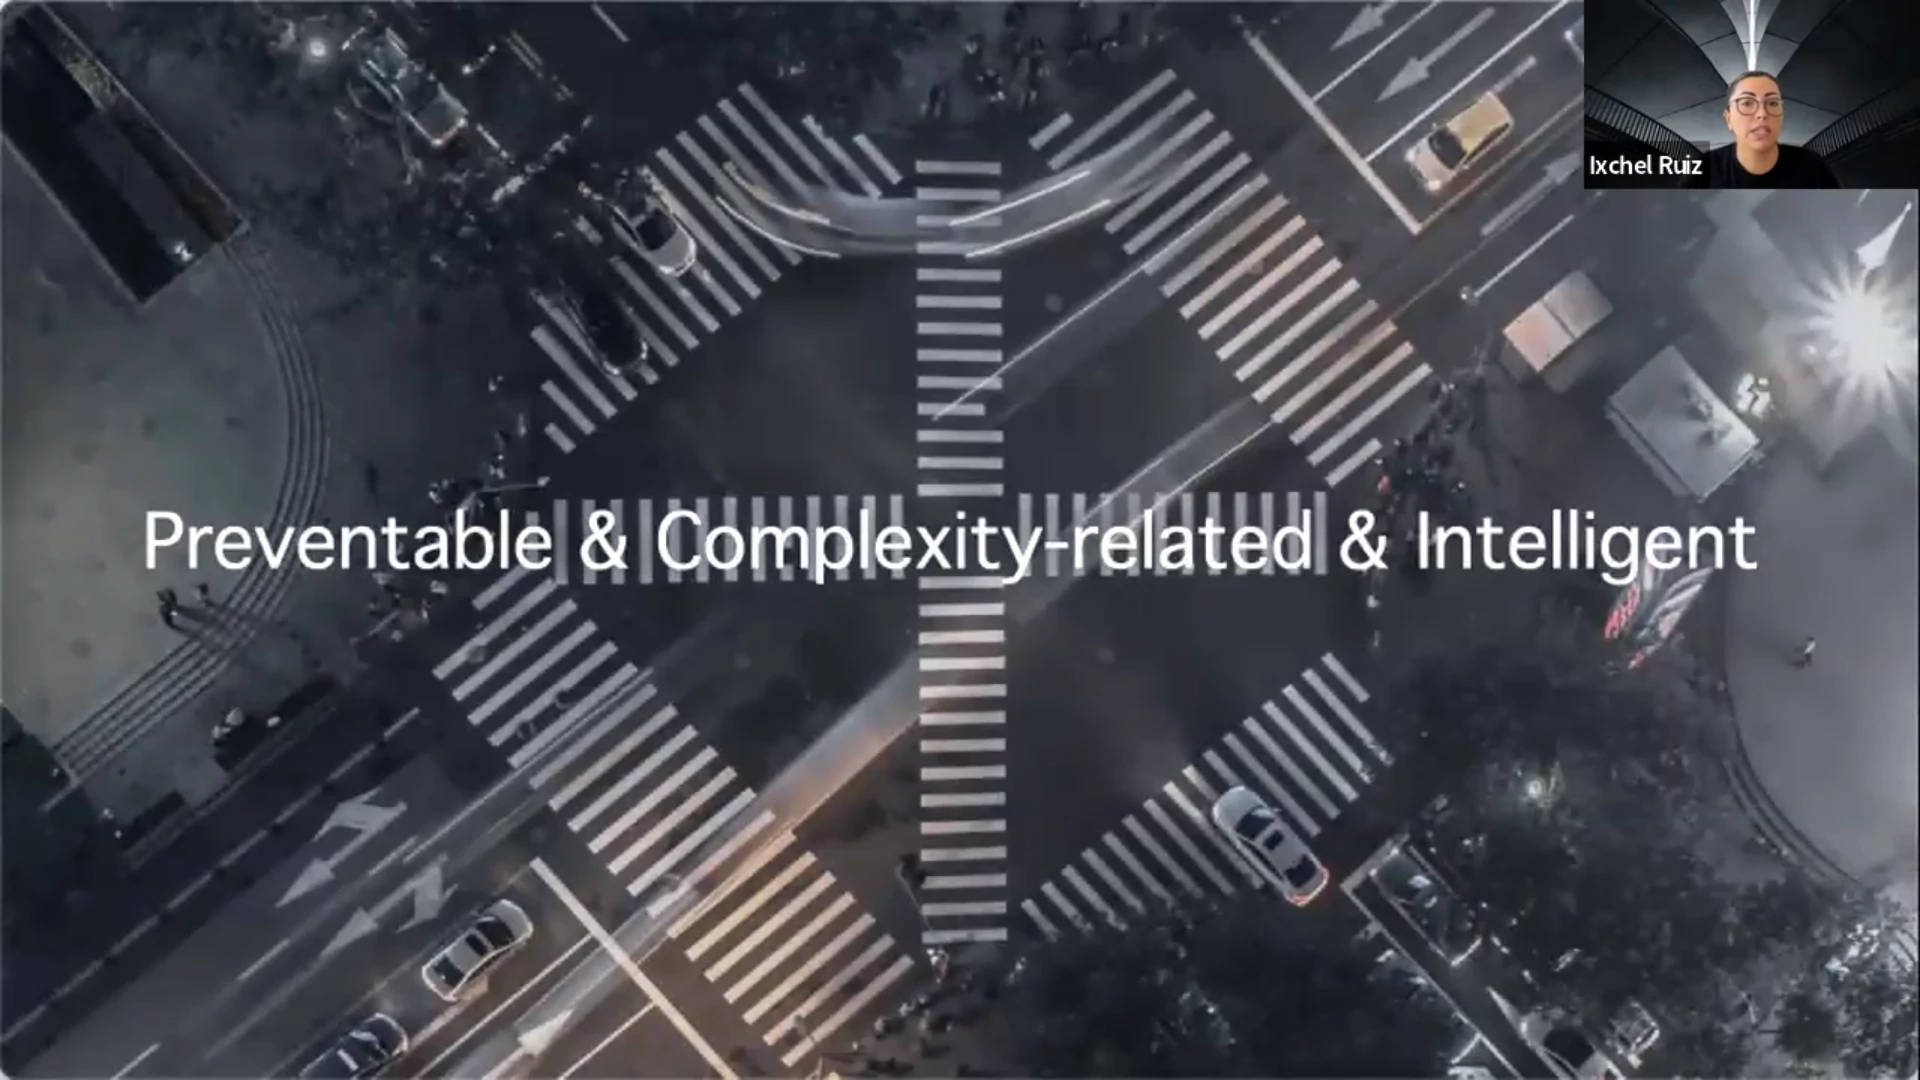
Not all failures are created equally. There are three types:
- Preventable
- These are the “bad” failures. There’s no reason to allow these.
- Complexity related
- These failures are due to the inherent uncertainty of work. Usually it is a particular combination of needs, people and problems that cause them.
- Intelligent
- The “good” failures, since they provide new knowledge.
Steps to learn from failures:
- Recognize
- Understand the cause
- Extract lessons to prevent future failure
- Share the information
- Practice for the next failure in a safe and controlled setting
Increase return by learning from every failure, share the lessons and review the pattern of failures. Do note that none of this can happen in an environment without psychological safety. You need to feel safe to discuss your failure, doubts or questions to be able to learn.
Accurate Metrics — Christina Zeller and Marcus Crestani
A manufacturing process was monitored and there was a nice dashboard to show whether there were any problems. However, at a certain moment there was a problem, but the dashboard was still claiming everything was fine.
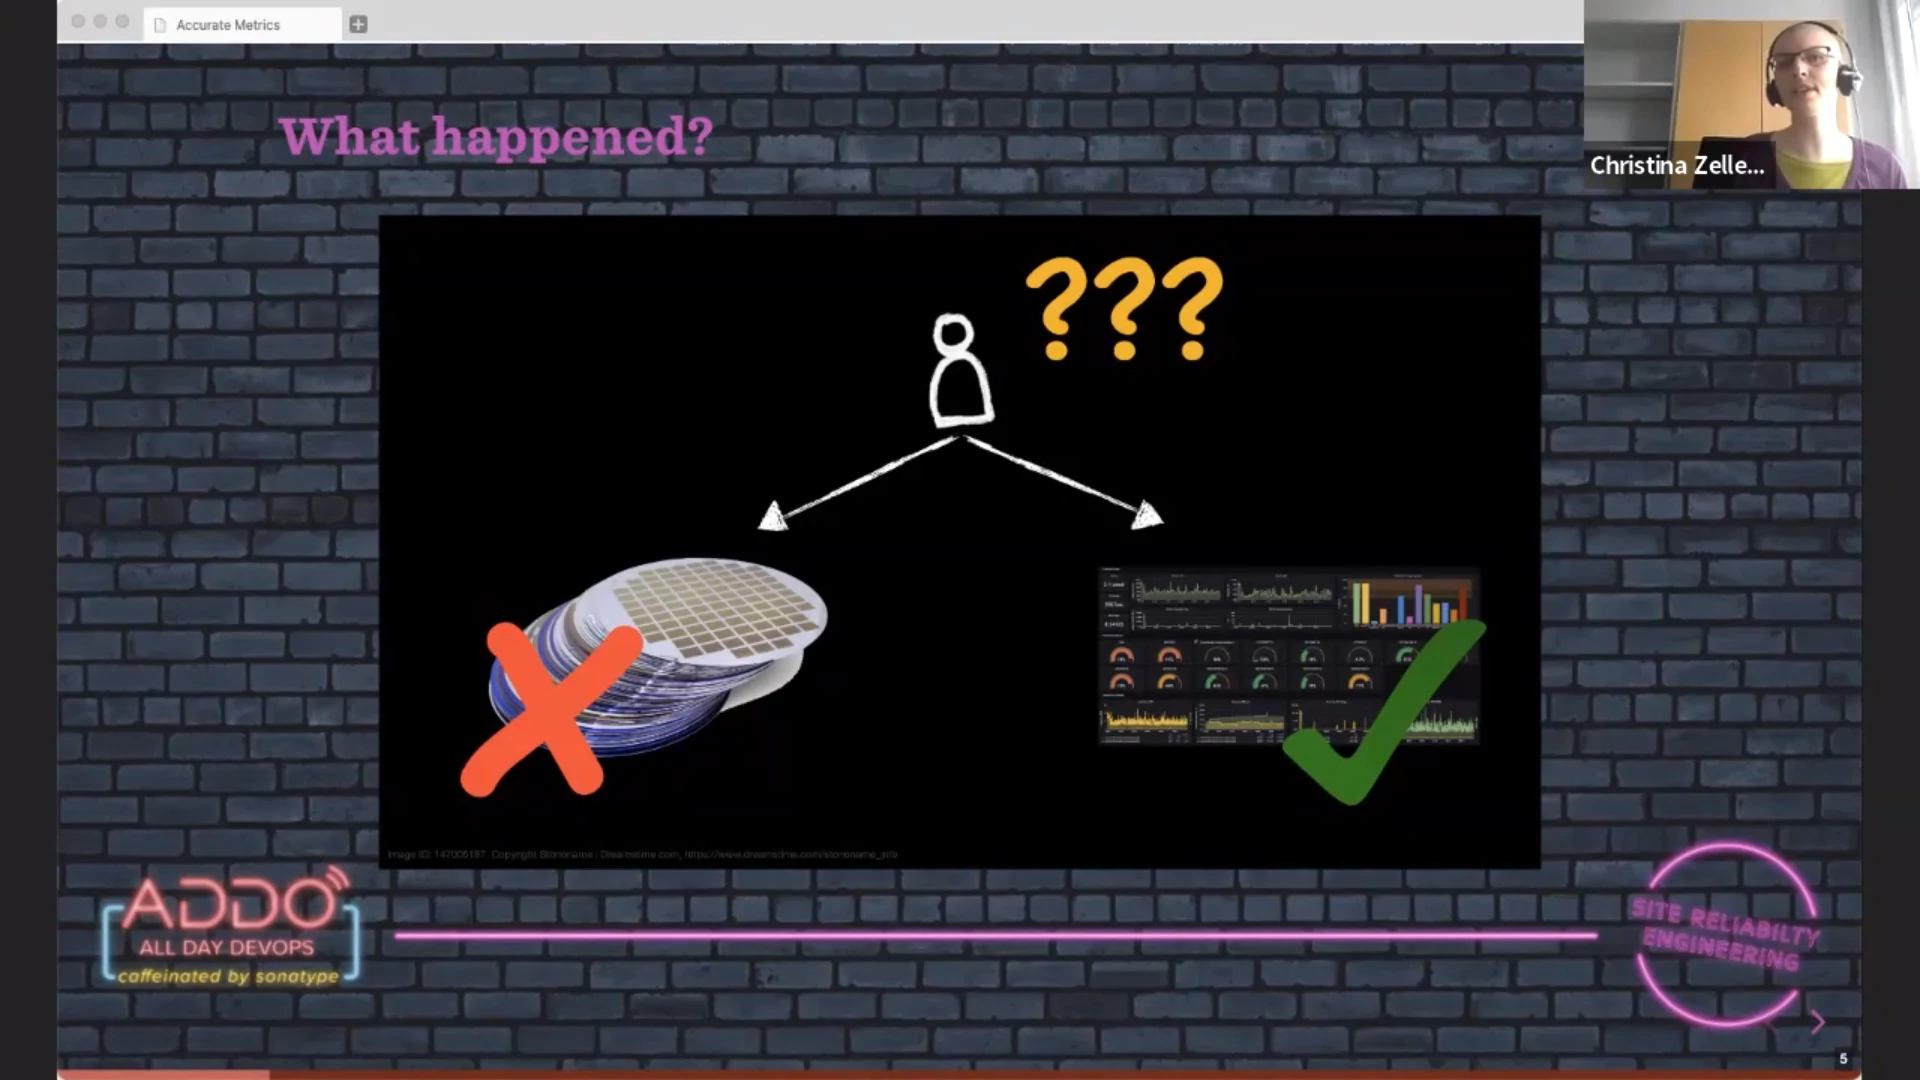
What was going on? Unreliable network? Erratic monitoring system? Flawed collection of metrics? It turned out to be all of them.
Sampling rates, retention policy and network issues can cause missing measurements in your time series database. This missing information can cause a drop in failure rate if you are unlucky enough that the missing samples are failed ones. So you think everything is fine, but there is something wrong in your environment.
Modelling metrics differently can help. One possible improvement is to have a duration sum in your metrics instead of just the duration. If you now miss a sample, the sum will still indicate that there has been a failure.
Using histograms is even better since you place values in buckets, e.g. failures in our case. A disadvantage however is that the metrics creation system must now also know what qualifies as a success or failure.
Takeways:
- Always collect metrics
- Check that your metrics match reality
- Always consider missing data
- For duration metrics always use histograms
After improving their metrics, the monitoring system matches the actual state of the manufacturing environment again.
Tip: look into hexagonal architecture, also known as “ports and adapters architecture.”
Why Is It Always DNS, TLS, and Bad Configs? — Philipp Krenn
DNS, TLS and bad config are where failures are waiting to haunt us when we least expect it. We need to have a tool to find the issues in our system early on. Health checks can be this essential tool to alert us.
You are able to narrow down where the issue is if you structure your health checks like this:
- Outside the network (different provider)
- This allows you to detect issues with e.g. DNS, the uplink, a firewall, a load balancer, service availability and latency.
- On the network (different AZ)
- If you are on the network, you could see issues with the network, firewall, TLS, service availability and latency. You can compare your measurements from outside with what you see on the inside.
- On the instance
- Again, by comparing the local point of view with the outside, you can detect issues with service availability, proxy vs service, latency, dependencies (e.g. a database that is slow or the service cannot reach)
Examples of tests you can use:
- Ping a host
- Setup a TCP connection
- Do an HTTP request
- POST data to a service
- Synthetic monitoring where you simulate button clicks
Health checks are cheap to run and give you a fast overview. They do not replace observability and only tell you something is broken, not what is going on. Start simple and only add synthetics when/where needed since they more complex.
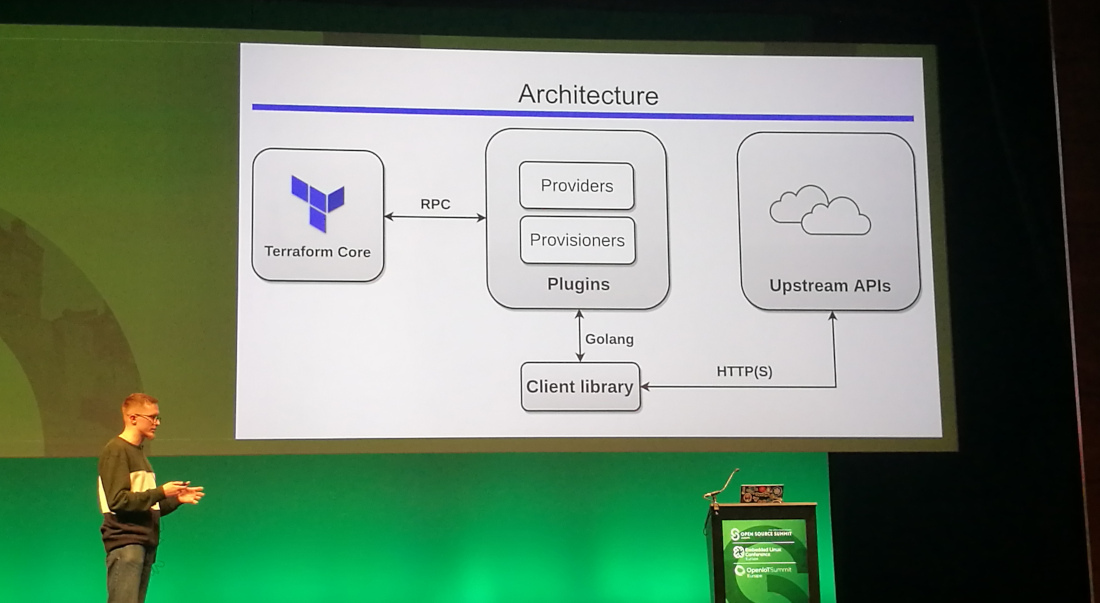
Comprehending Terraform Infrastructure as Code: How to Evolve Fast & Safe — Anton Babenko
By using Terraform AWS modules you’ll have to write less Terraform code yourself, compared to using the AWS provider resources directly.
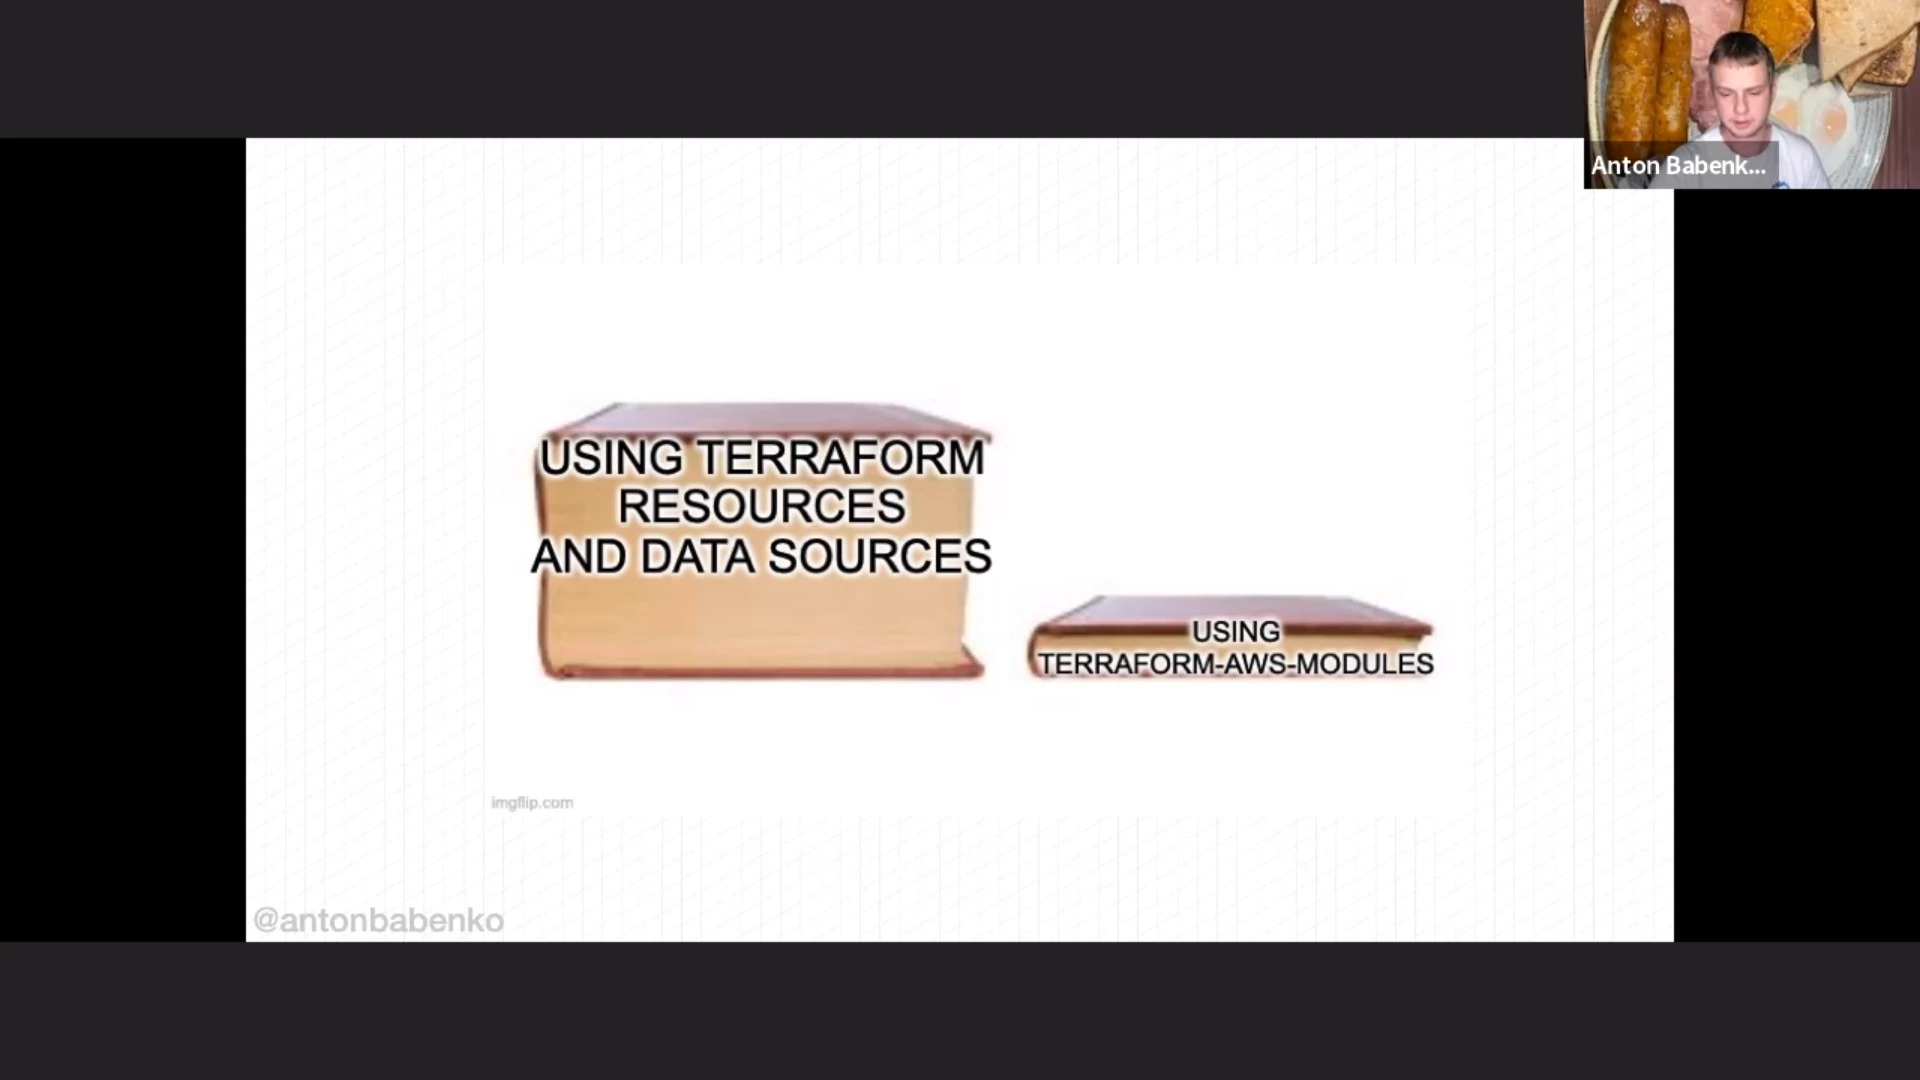
For example: if you write your own Terraform code from scratch for an example infrastructure with 40 resources, you’ll need about 200 lines of code. Once you introduce variables, that code base will grow to 1000 lines of code. When you then split it up into modules, you’ll need even more code.
Instead, if you use terraform-aws-modules you’ll have more features than your
own modules would only need about 100 lines of code.
Questions with regard to terraform-aws-modules:
- Why?
- Understandability is an important issue. To help with these questions (like “why is it done this way?") there are autogenerated documentation and diagrams. A visualization of the dependencies also helps.
- Does it work?
- The project focusses on static analysis (using
tflintandterraform validate) and running Terraform on examples. Anton thinks that testing code should be for humans (so HCL is better than Go). - How to get feedback quicker?
- Options: run Terraform locally instead of in CI/CD pipeline, simplify the code, and restrict surface area of your code using policies, guardrails, etc. Split up your Terraform code, with different states, to speed up Terraform runs.
Most important word for this talk: understandability.
50-67% of time for software projects spent on maintenance.
Some useful links Anton listed:
- terraform-community-modules
- terraform-aws-modules
- Various links to Anton’s Terraform, AWS, and DevOps projects
- Collection of git hooks for Terraform
- Doing serverless with Terraform
- www.terraform-best-practices.com
- Your weekly dose of #Terraform by Anton
- Terraform weekly
- Anton on Twitter (@antonbabenko)
- Developers spend most of their time figuring the system out
- Diagram as Code
- terraform-diff
- terraform-compliance
- LocalStack
Keynote: Journey to Auto-DevSecOps at Nasdaq — Benjamin Wolf
Why DevOps? It can be pretty complicated to explain, even though it is an obvious choice for Nasdaq. For most people Nasdaq is a stock exchange but it is actually a global technology company. Sure, they run the stock exchange, but also provide capital access platforms and protect the financial system.
Nasdaq develops and delivers solutions (value) for their users. They manage and operate complex systems. It has been around for a while. So again, why DevOps? The answer is: to get better at their practices.
- They want to deliver solutions (value) to their users efficiently, reliably and safely.
- They want to manage and operate complex systems efficiently, reliably and safely.
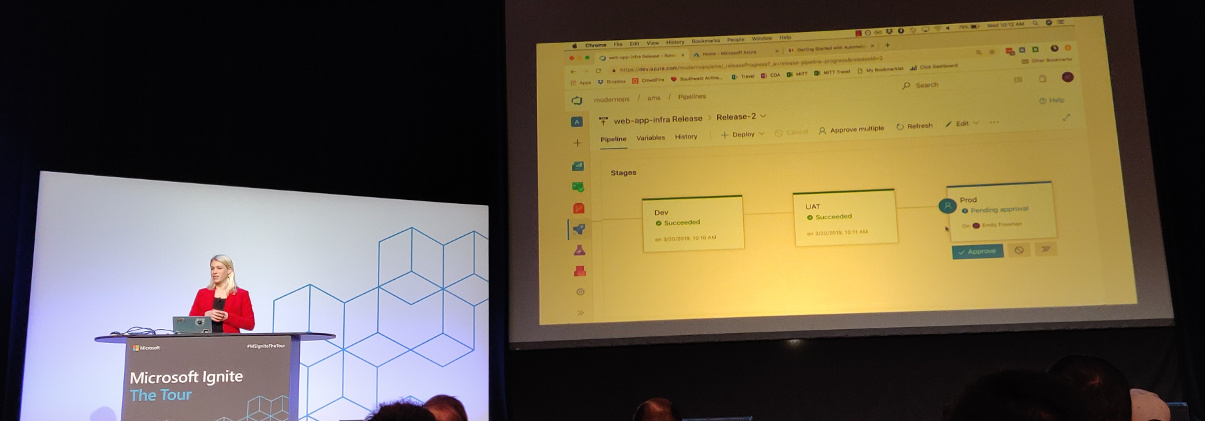
Years ago they had manually configured static servers and the development teams were growing. They automated software deployment to a point where the product owners could trigger the deployment, and even pick which branch to deploy. This was an important first evolution. They had a “DevOps team” to handle this automation.
The second evolution for Nasdaq was moving from a data center to the cloud, using infrastructure as code (IaC). The question they asked themselves was what to do first: migrate to cloud or get their data center infrastructure 100% managed via IaC? They made the ambitious decision to do both at once.
By turning your infrastructure into code, you can create and destroy the environment as many times as you like. And this was welcome: after about 2100 times they “got it right” and were able to move over the production environment to the cloud. Without IaC this would not have been possible as flawlessly as it did.
The cloud and IaC brought them:
- Efficiency: maintenance, patching, capacity
- Reliability: self-healing, immutable
- Safety: immutability, destroy/create
Over time the DevOps team started to handle a lot more work. The team consisted of system administators, but they were required to work as developers (make code reusable, use git, etc). The DevOps team started to complain about being overloaded and they became a bottleneck since a lot of development teams came to them with problems (failing builds, cloud questions).
On the other side, the development teams stared to complain because they are dependent on the DevOps team but that team had become the bottleneck. And “just” scaling up the DevOps team would not solve the problem.
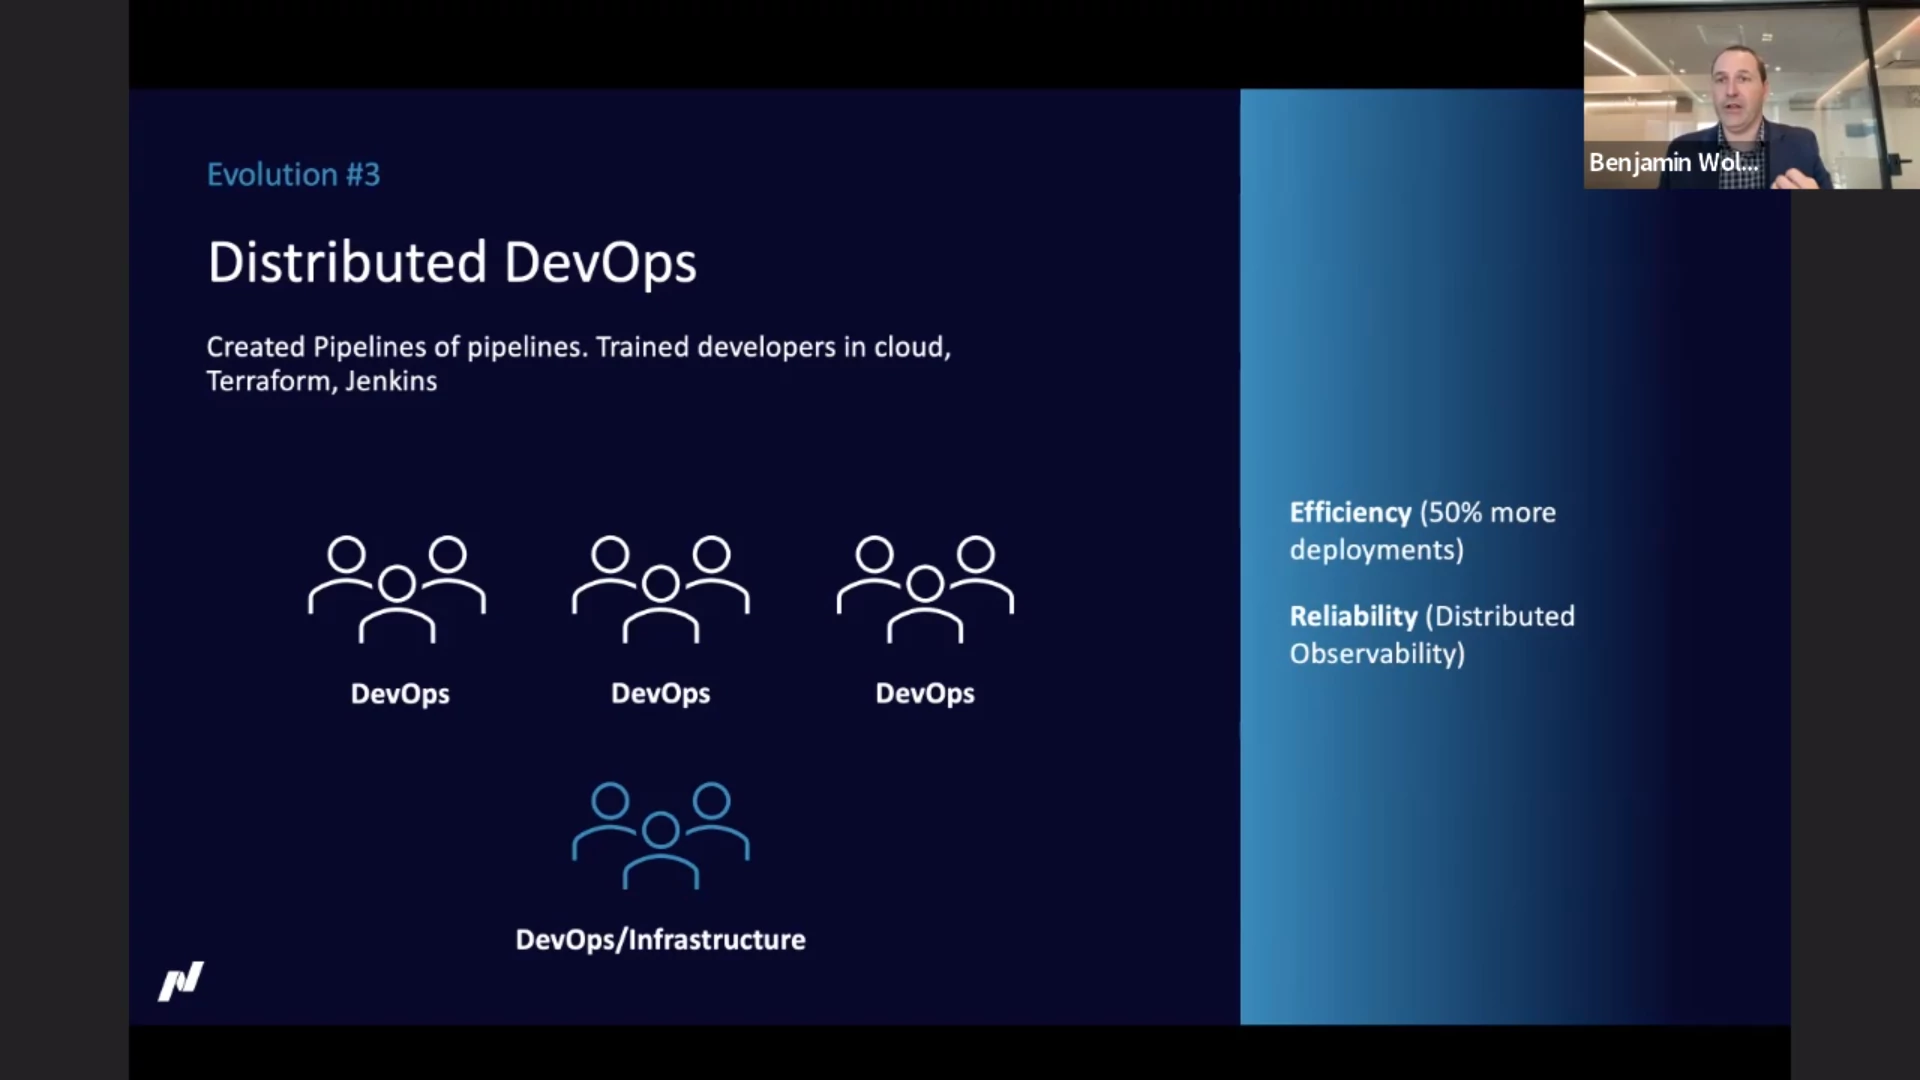
Where the second evolution was about the technology, the third evolution was about efficiency. They moved to a “distributed DevOps” model. Developers were empowered: access to logs and metrics, training (cloud, Terraform, Jenkins). By creating a central observability platform, developers could get insight in what is going on, without the need to have access to the production environment.
This resulted in more deployments and enhanced reliability of the deployments because of the observability platform.
A year or three later, new cracks appeared. Standards were diverging because teams were allowed to pick their own path (libraries, databases, pipelines, Terraform code, etc). It also lead to practices that needed to be fixed (e.g. lack of replication). Standardizing this led to quite a burden at the start of a project: lots of basic stuff to setup.
Developers needed to be experts in a lot of technology, from JavaScript and the JavaScript framework in use, via multiple .NET versions to Terraform and other deployment related tech. An easy way to solve this situation was to flip back to the previous situation with a single team responsible for deployment and such. But this would basically mean recreating the bottleneck.
The ownership itself was not the problem. The efficiency was, because of the boilerplate needed for teams. Stuff you want to do the same across the teams. They wanted to empower the development teams, but also give them the standards for databases, messaging, etc. Instead of copying a template and have teams diverge afterwards, they looked into packaging to also make it easier to update afterwards.
This lead to evolution four with marker files, packages, code generators and auto-devops pipelines. The pipeline looks at the markers (“hey, this is a .NET app”) and can then apply a standard pipeline. Nasdaqs code generators create the boilerplate for the teams so within two minutes of starting with a new application you’re able to write code to solve your business problem, instead of having to create boilerplate code yourself first.
The developers can get up and running quickly, but in a safe way.
The development teams are all DevOps teams now, but Nasdaq also has a specialized team for the complex areas (hardware, networking, etc). There is also a “developer experience” team that focusses on the tools for the developers, like the code generators.
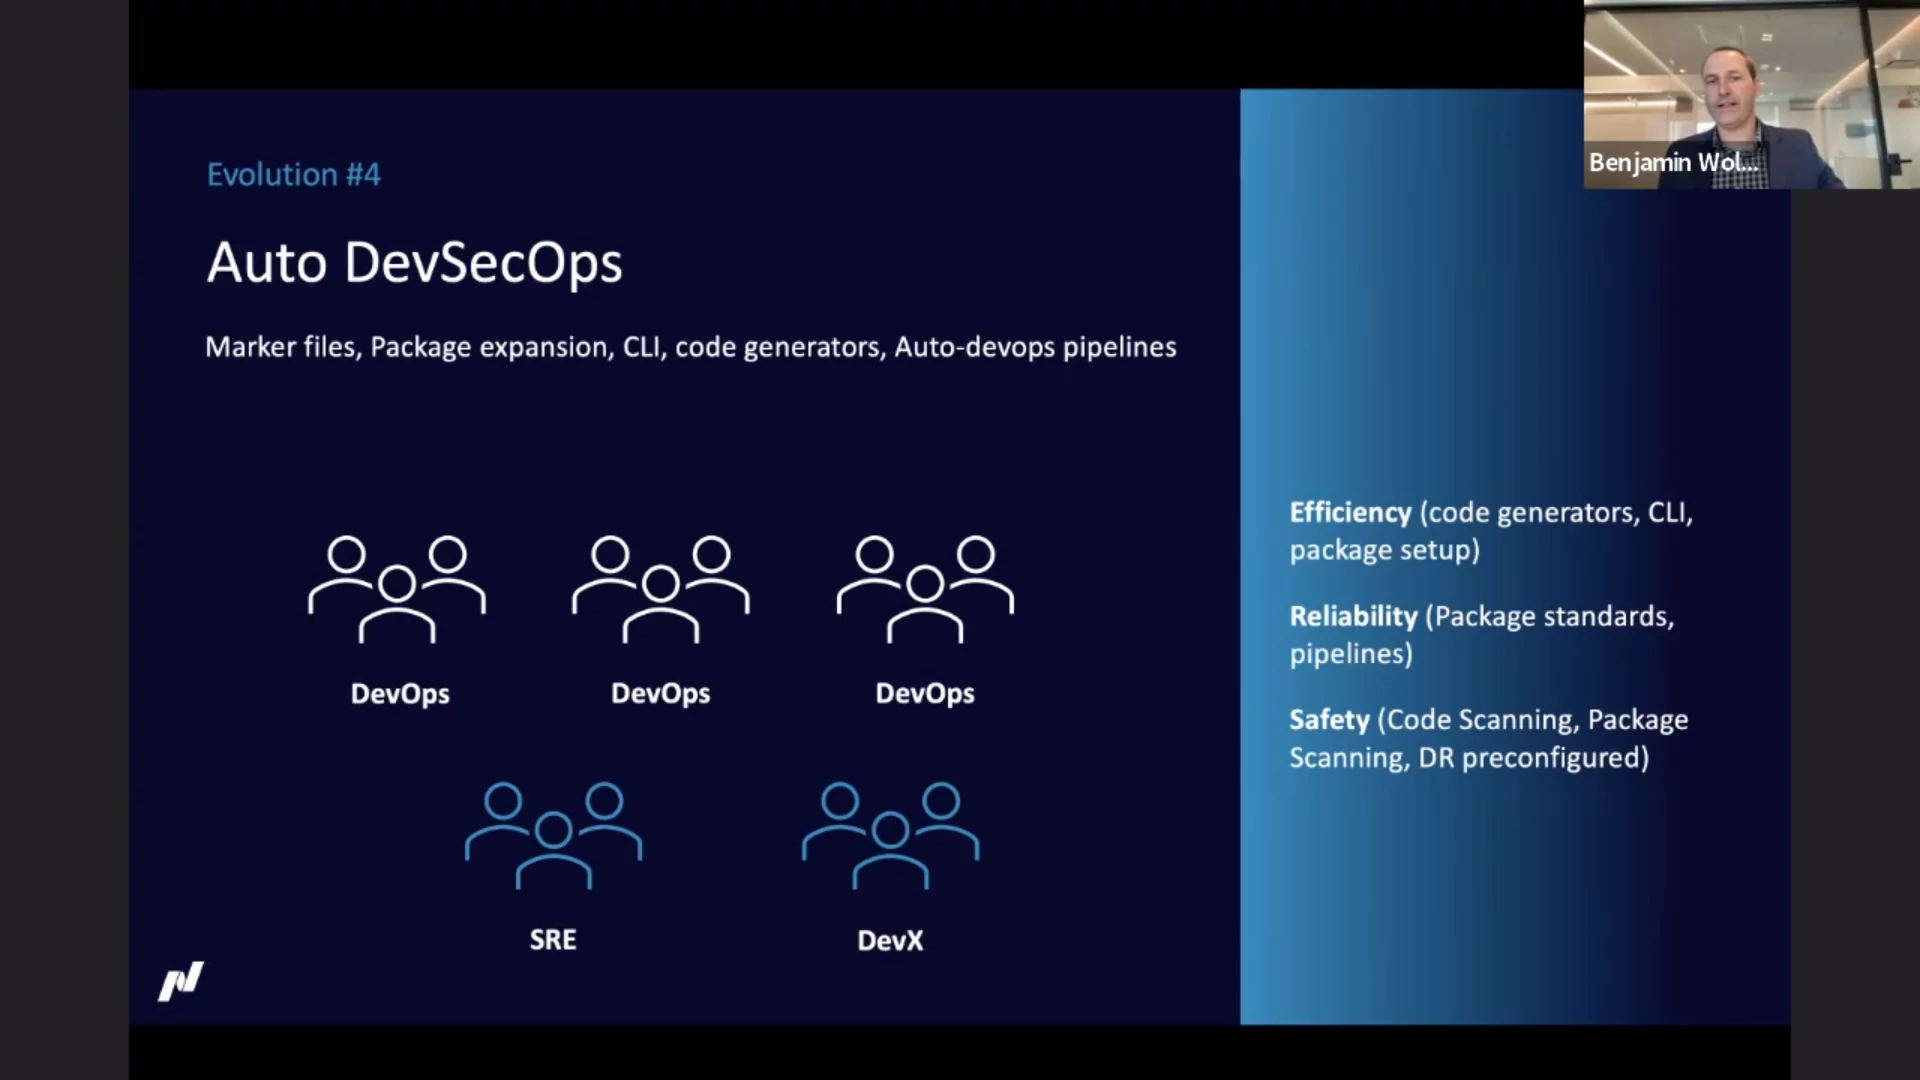
Current status with regard to our three key areas:
- Efficiency: code generators, CLI, package setup
- Reliability: package standards, pipelines
- Safety: code scanning, package scanning, disaster recovery preconfigured
Varieties of Incident Response — Kurt Andersen
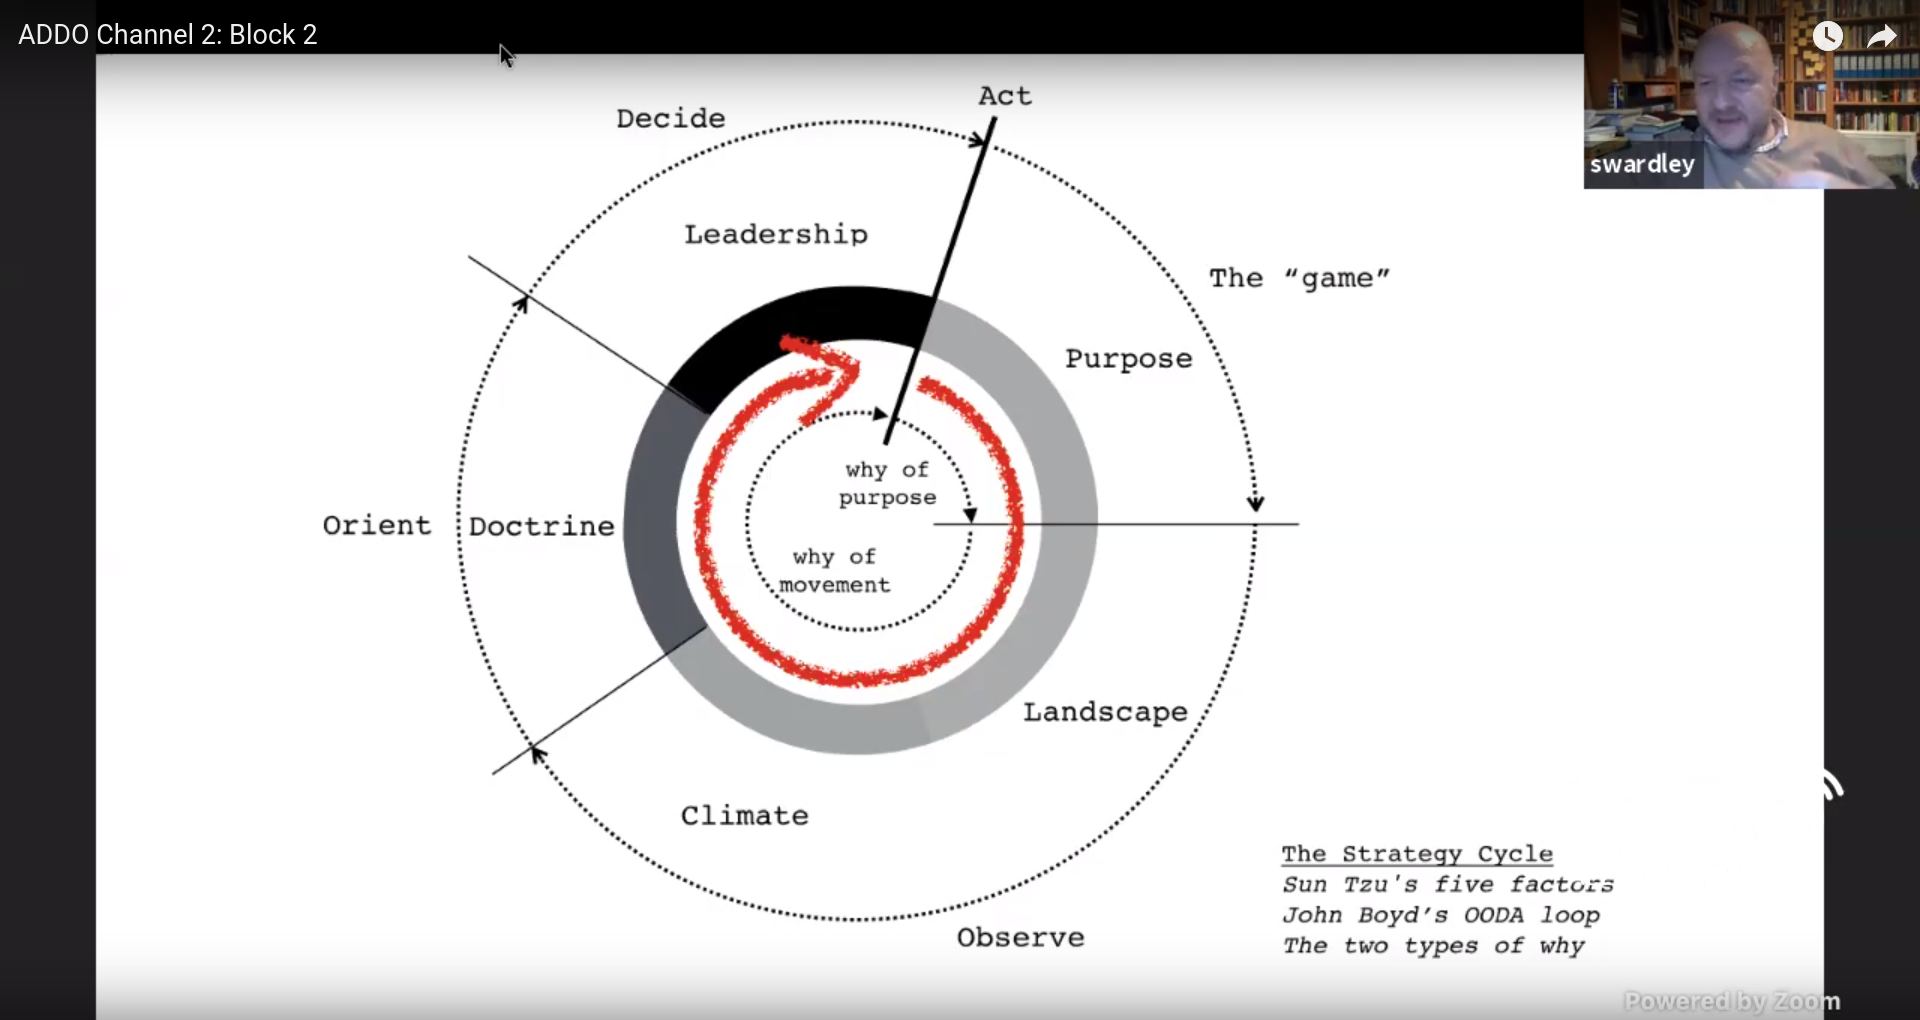
No matter how reliable our systems are, they are never 100% — an incident can always happen. When the pager goes off, the first step is to recruit a response team. This team can then observe what is going on. They need to figure out what this means (orient themselves) and decide what to do. And finally they can act to resolve the problem. (The OODA loop.)
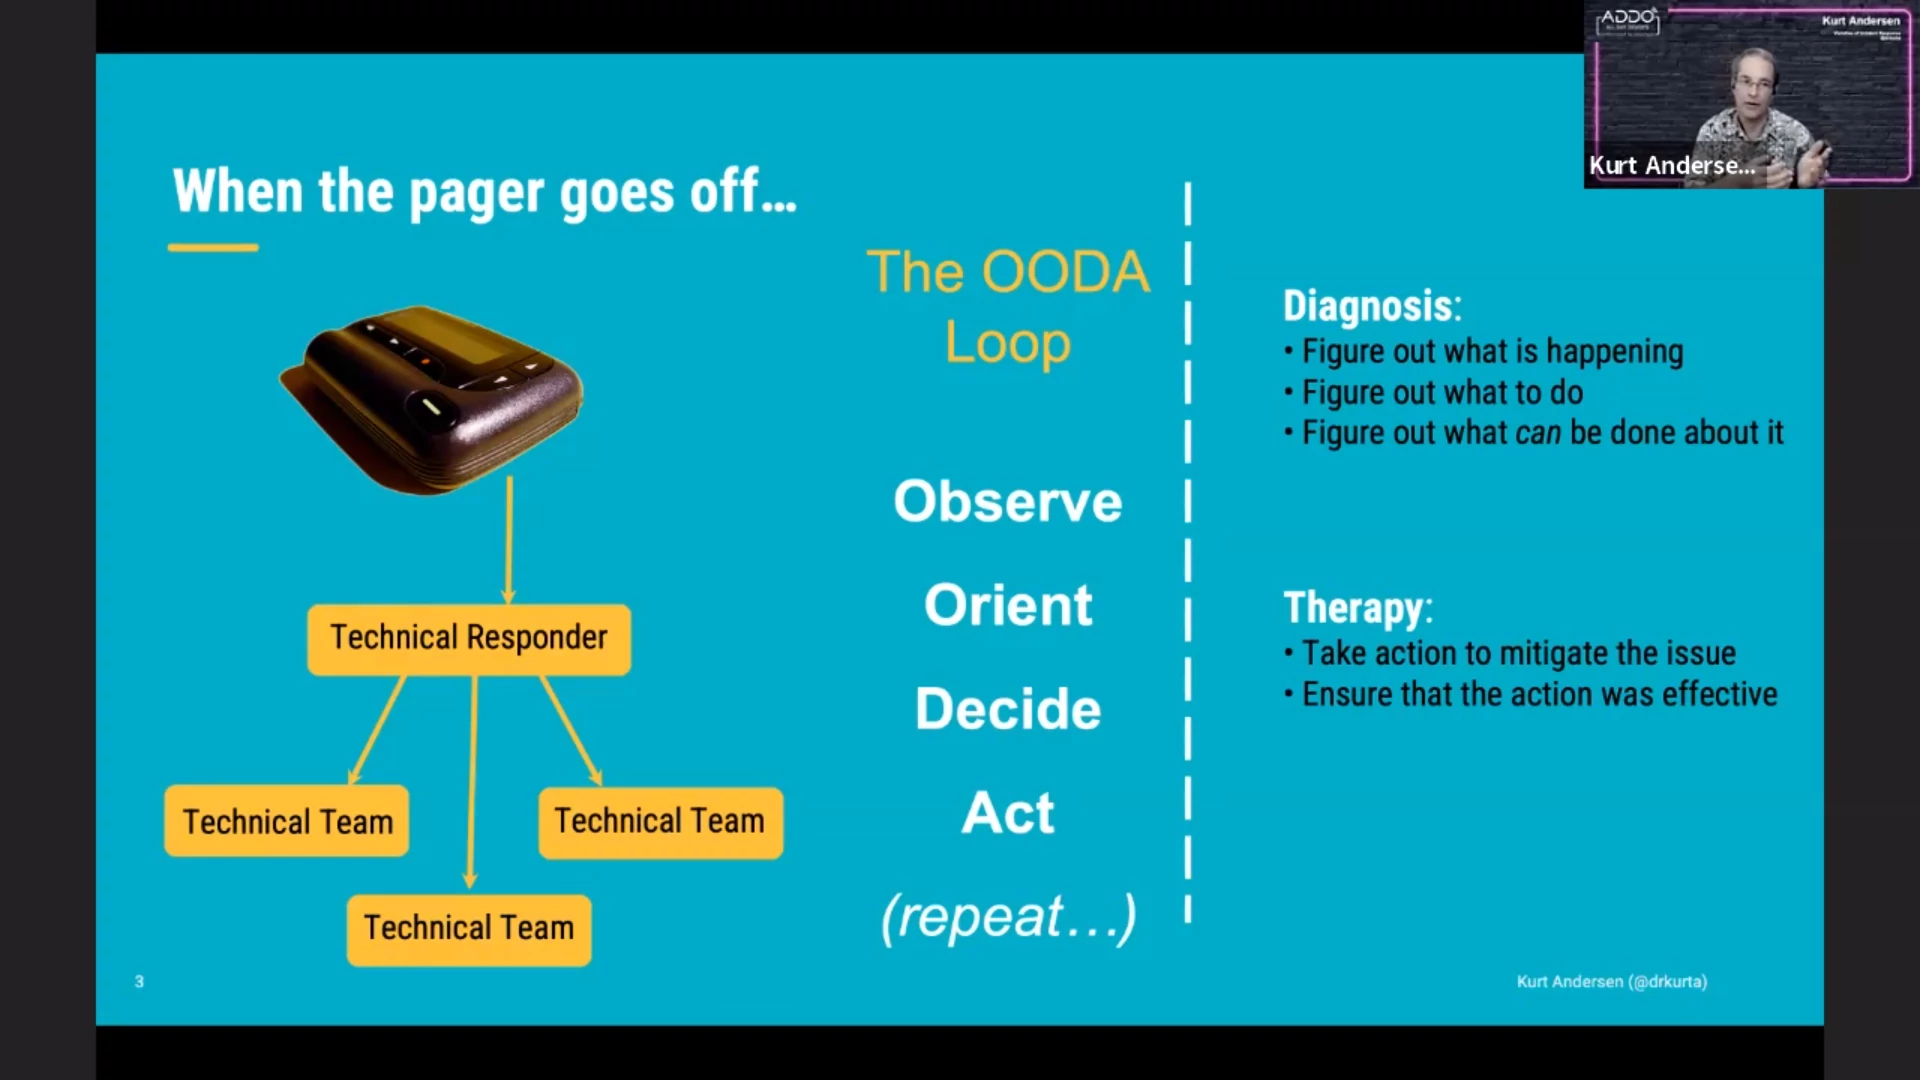
Getting the right people involved can be hard for the technical responder; they themselves might want to dive into the technical stuff first. This is where the “incident commander” role comes in. The incident responder will recruit the team to get the right people involved, coordinate who does what and handle communication with people outside of the response team. (The latter can also be handled by a dedicated “comms lead” if needed.)
But how does the incident commander get involved?
A fairly standard approach for an on-call system will be to have a tiered model: tier 1 (NOC), tier 2 (people generally familiar with the system) and tier 3 (the experts of the system having the issue). The problem with this model: where does the incident commander come from? Tier 1? If so, can the incident commander follow through if the issue is handed over to the next tier?
Another model (“one at a time”): team A gets involved, decides it is not their responsibility, hands over to team B, which kicks it to team C, etc. Where does the incident commander come from in this model?
The aforementioned models only work in the simplest cases. They share a few big problems: handoffs are hard and there is no ownership, which results in loss of context. To mitigate this, some teams have an “all hands” approach where everyone is paged and everyone swarms into the incident response. However, most people on the call (or in the war room) cannot contribute. This leads to a mentality of “how quickly can I get out of here?”
Yet another approach is an Incident Command System (ICS), which comes from emergency services. In this approach the alert goes to the incident commander who then involves the team. While this works in some organizations, in tech it’s usually a bit too regimented.
The ICS morphed to an “adaptive ICS” where the technical team has more autonomy, but the incident commander is still involved. This system can be scaled up to where there’s an “area commander” role which coordinates separate teams (via their respective incident commanders).
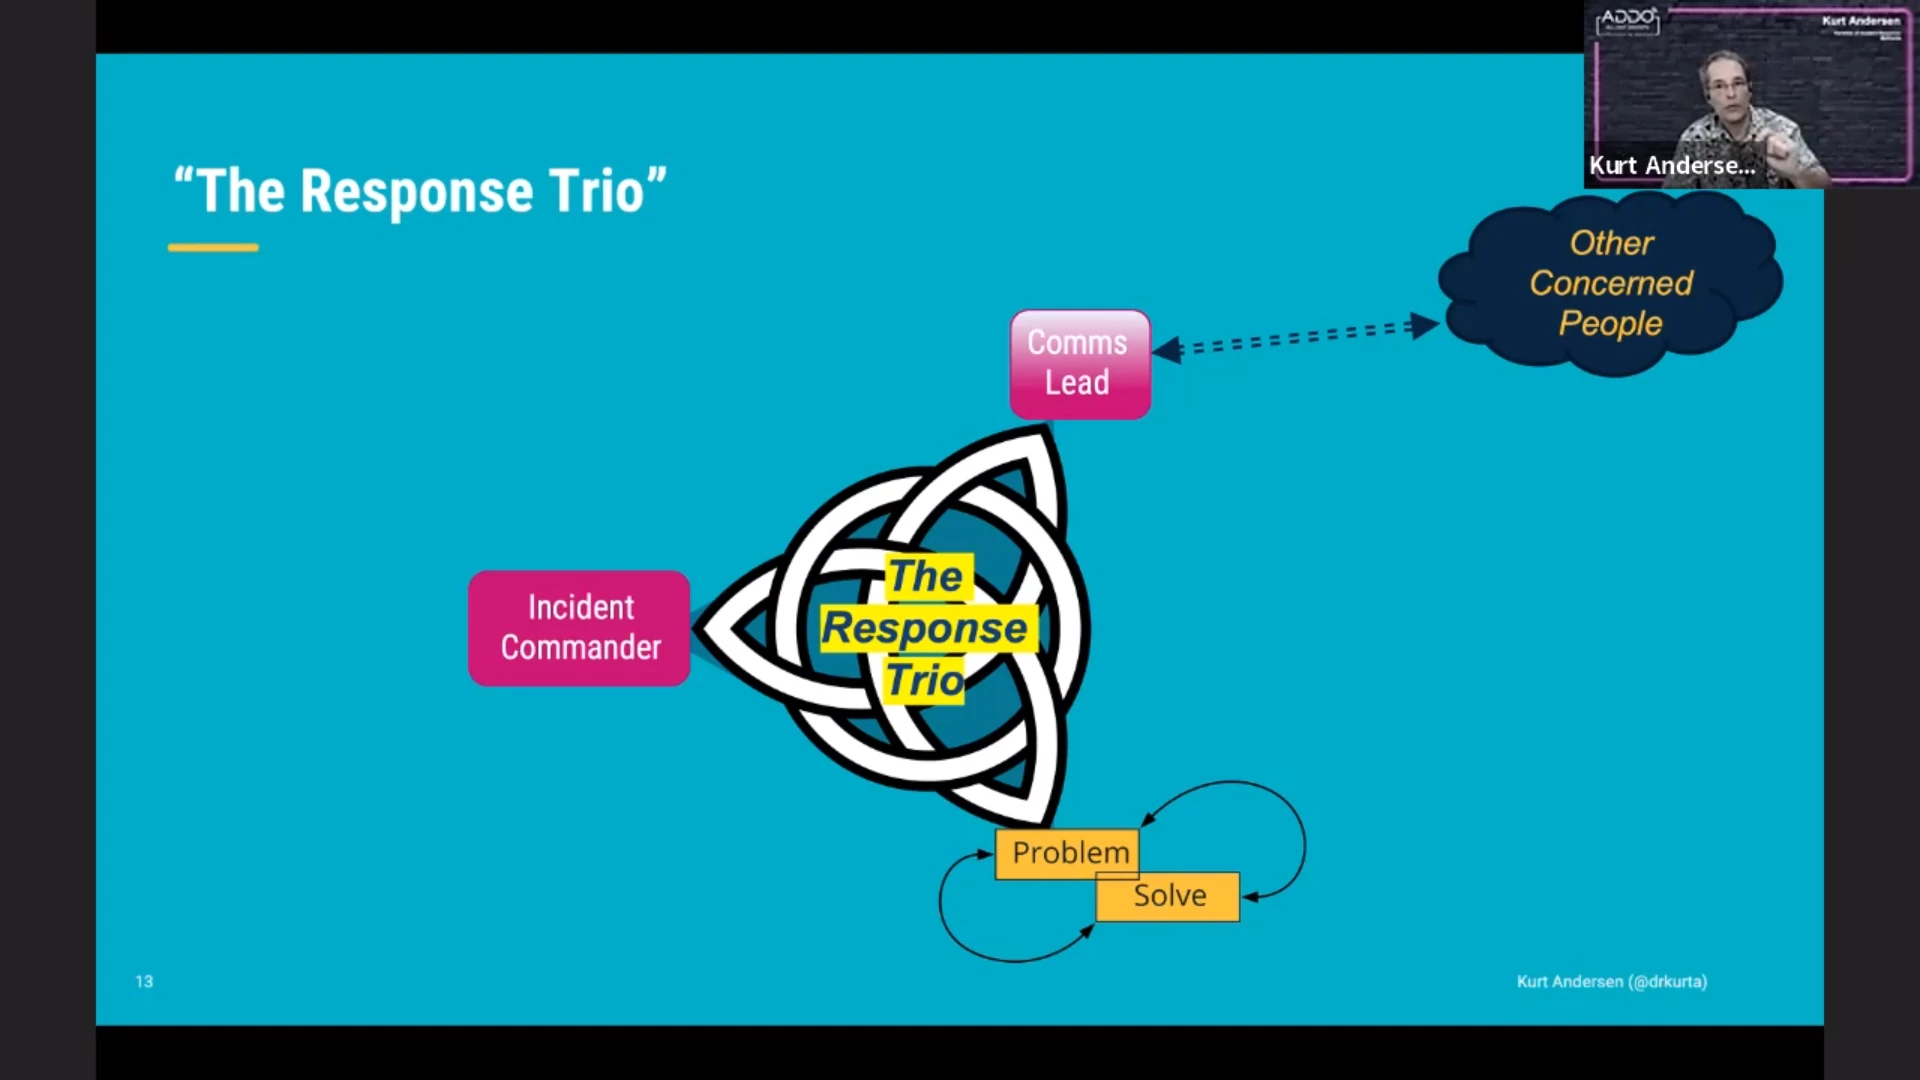
Summarizing the roles of the parties in the “response trio”:
- incident commander: coordination
- tech team: nitty-gritty to solve the problem
- comms lead: maintain contact with stakeholders
Each role will perform their own OODA loop from their own perspective.
But we started the story in the middle. We need to get back to the beginning and ask the question “why is the pager making noise?” Perhaps the first question one should ask is: “is this something actionable?” If it is not or if it is something you can handle in the morning, perhaps you do not have to respond in the middle of the night.
Cut down the noise and focus on the signal.
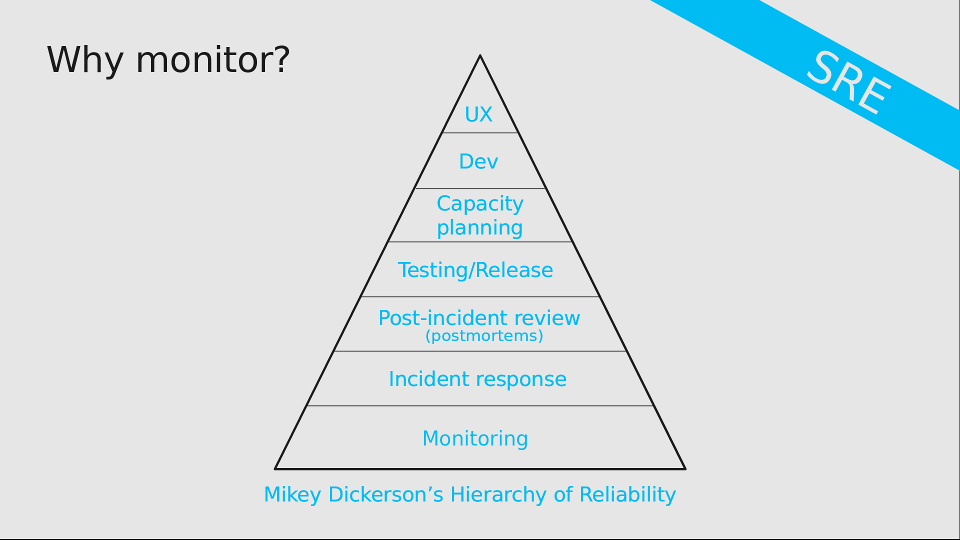
The E Stands for Enablement - Modern SRE at PagerDuty — Paula Thrasher
PagerDuty had an idea what SRE meant: they were enablers. You can hit them up on Slack and they help you out with a problem. Having an SRE team initially reduced the total minutes in incident in a year. But when PagerDuty grew further, the number went up again. Oops.
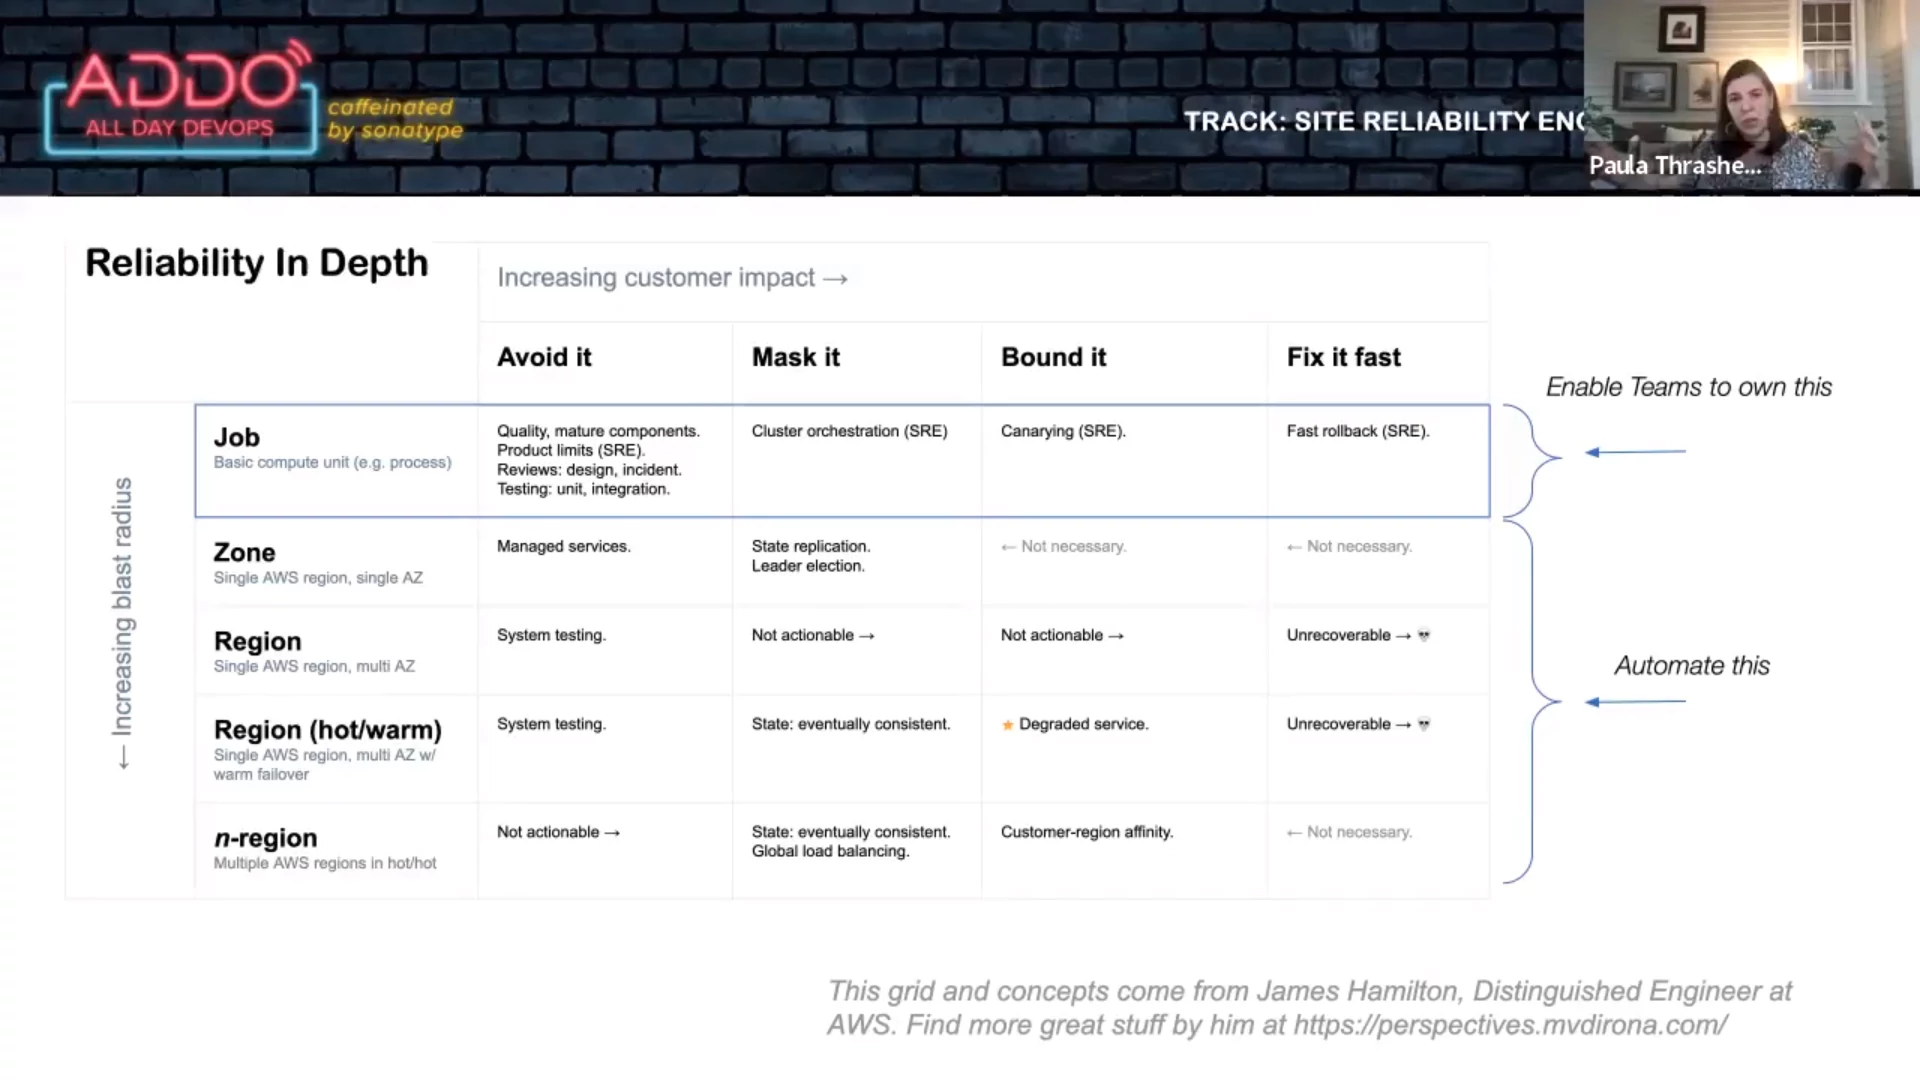
The “get well” project required teams to have the following:
- Fast rollbacks: all rollbacks have to happen within 5 minutes. The SRE team provided guidelines to help teams achieve this.
- Canary deploys: teams must test changes (canary) first. The SRE team enabled this via tooling.
- Product limits: reasonable limits. The SRE team made this possible via telemetry and monitoring.
Results:
- Lower number of minutes in major incident
- Lower mean time to resolve
- More “incidents averted”: four minor incidents were resolved before they caused real harm.
Important elements that made this “get well” project possible:
- Clear, measurable goals
- Enabled by tools and templates
- Gave teams a path to do it
- Experts were available to coach
- The teams owned the implementation themselves
- The teams were held accountable
PagerDuty used Backstage as an internal “one stop shop” developer portal with documentation and insights. It also integrates with the development systems.
]]>