<?xml version="1.0" encoding="utf-8"?>
<feed xmlns="http://www.w3.org/2005/Atom" xml:lang="en">
  <title>Posts tagged with “Sre” on Mark van Lent’s weblog</title>
  <updated>2022-11-10T00:00:00+00:00</updated>
  <link rel="self" type="application/atom+xml" href="https://markvanlent.dev/tags/sre/index.xml" hreflang="en"/>
  <id>tag:markvanlent.dev,2010-04-02:/tags/sre/index.xml</id>
  <link rel="alternate" type="text/html" href="https://markvanlent.dev/tags/sre/" hreflang="en"/>
  <author>
      <name>Mark van Lent</name>
      <uri>https://markvanlent.dev/about/</uri>
    </author>
  <rights>Copyright (c) Mark van Lent, Creative Commons Attribution 4.0 International License.</rights>
  <icon>https://markvanlent.dev/favicon.ico</icon>
  <entry>
    <title type="html"><![CDATA[All Day DevOps 2022]]></title>
    <link rel="alternate" href="https://markvanlent.dev/2022/11/10/all-day-devops-2022/" type="text/html" />
    <id>https://markvanlent.dev/2022/11/10/all-day-devops-2022/</id>
    <author>
      <name>map[name:Mark van Lent uri:https://markvanlent.dev/about/]</name>
    </author>
    <category term="conference" />
    <category term="costs" />
    <category term="devops" />
    <category term="failure" />
    <category term="metrics" />
    <category term="observability" />
    <category term="sre" />
    <category term="terraform" />
    
    <updated>2022-11-10T21:32:11Z</updated>
    <published>2022-11-10T00:00:00Z</published>
    <content type="html"><![CDATA[<p>Today was the 7th <a href="https://www.alldaydevops.com/">All Day DevOps</a>. Just like
<a href="/2021/10/28/all-day-devops-2021/">last year</a> the organizers managed to get 180
speakers, spread over 6 tracks, to inform, teach and entertain us. As usual I
made some notes of the talks that I attended.</p>
<p><img src="/images/all_day_devops_2022_banner.webp" alt="All Day DevOps 2022 banner"></p>
<h2 id="keynote-the-rise-of-the-supply-chain-attack--sean-wright">Keynote: The Rise of the Supply Chain Attack &mdash; Sean Wright</h2>
<p>Dependency managers (like Apache Maven) changed the way software is being
developed: using those makes it much easier to use dependencies in your
application (you don&rsquo;t have to fetch them manually yourself). As a result,
building your own libraries is now less common, using an available (open source)
library is much easier.</p>
<p>To get a feel for the scale: NPM serves 2.1 trillion annual downloads
(requests). This obviously includes automatic builds, but the growth over the
last couple of years has been exponential none the less. And using third party
libraries can be a very good thing. Good libraries can be much more secure and
have less bugs than some library developed in house.</p>
<p>Types of supply chain attacks:</p>
<dl>
<dt>Dependency confusion</dt>
<dd>Register a private package (which you know is used by a company) in a public
repository. If the package manager searches for the package in the public
repository <em>before</em> the private one, the malicious package is used.</dd>
<dt>Typo squatting / masquerading</dt>
<dd>Use misspelled or &ldquo;familiar&rdquo; names in the hopes someone uses the wrong package.</dd>
<dt>Malicious package</dt>
<dd>Malicious payload in a package that promises (and perhaps even delivers)
useful functionality.</dd>
<dt>Malicious code injection</dt>
<dd>Compromise of an existing package (e.g. by compromising the build system or
repository).</dd>
<dt>Account takeover</dt>
<dd>Malicious actor can log in as the original author.</dd>
<dt>Exploiting vulnerabilities in packages</dt>
<dd>Using a known or unknown vulnerability in a library.</dd>
<dt>Protestware</dt>
<dd>For example a legitimate library with notes protesting against the war in
Ukraine.</dd>
</dl>
<p><em>After this Sean unfortunately dropped from the session.</em></p>
<h2 id="taking-control-over-cloud-costs--amir-shaked">Taking Control Over Cloud Costs &mdash; Amir Shaked</h2>
<p>Reasons to analyze your cloud costs:</p>
<ul>
<li>Costs translate to profit</li>
<li>Usage is directly tied to costs (and if you don&rsquo;t properly monitor, your spend
could increase unexpected)</li>
<li>Be in control: by monitoring you can determine what impact certain actions
have on your business</li>
<li>Be intelligent: by knowing what you spend where, you can connect it to your
business KPIs</li>
<li>Save money</li>
</ul>
<p>You&rsquo;ll want to be aware when you scale (hyper growth) if your costs grow faster
than the number of users/sales/etc. You don&rsquo;t want to end up in a situation
where more success means <em>less</em> profit.</p>
<p>Things to look for in your environment:</p>
<ul>
<li>Unused resources</li>
<li>Over commitment</li>
<li>Under commitment</li>
<li>Price per unit we care about (e.g. users, sales, etc)</li>
<li>Bugs</li>
</ul>
<p>Best practices you can arrange from day one:</p>
<ul>
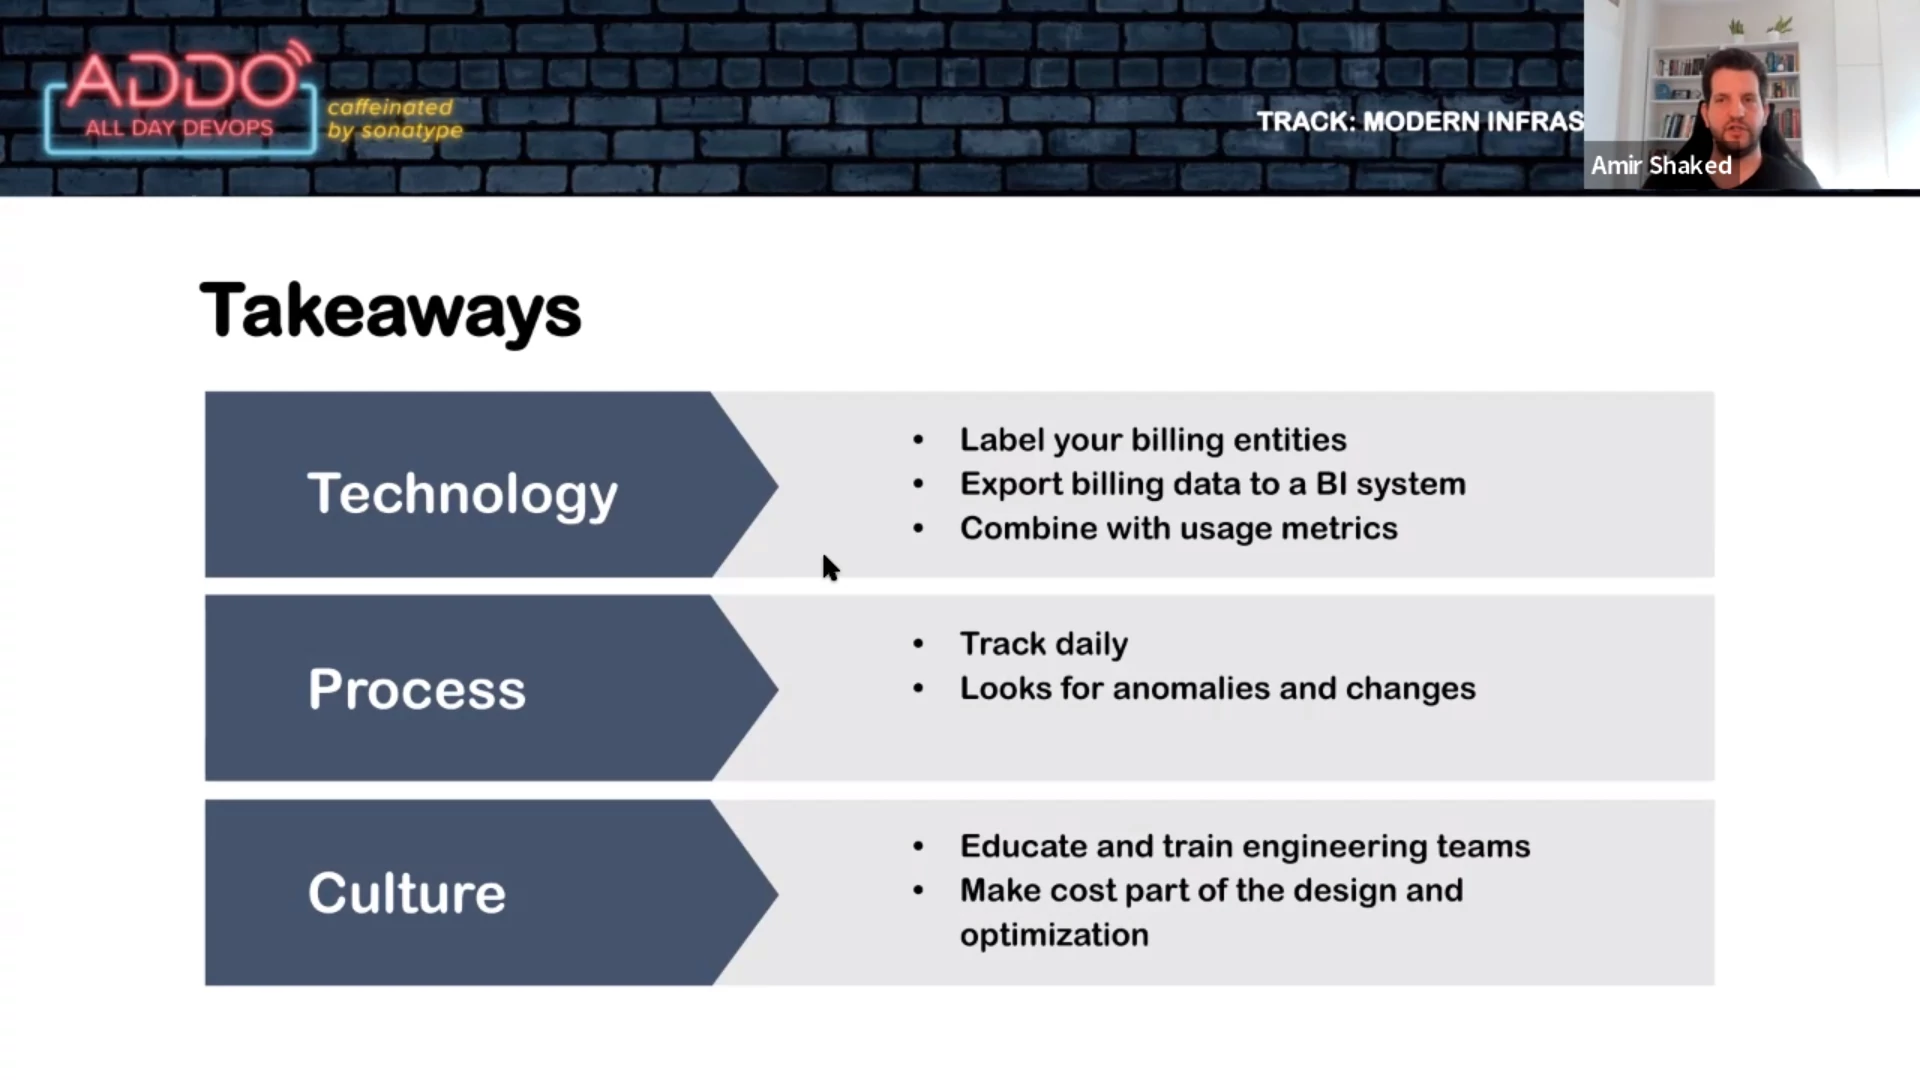
<li>Export billing data and create e.g. dashboards</li>
<li>Structure and organize resources for fine-grained cost reporting</li>
<li>Configure policies on who can spend and who has administrator permissions</li>
<li>Have a culture of &ldquo;showback&rdquo; in your organization. Make your employees aware of
the costs, have budgets and alerts.</li>
</ul>
<p><img src="/images/all_day_devops_2022_amir_shaked.webp" alt="Amir Shaked with the takeaways from his talk"></p>
<h2 id="beyond-monitoring-the-rise-of-observability-platform--sameer-paradkar">Beyond Monitoring: The Rise of Observability Platform &mdash; Sameer Paradkar</h2>
<p>Customer experience is important for your revenue. You need to deliver your
service and make sure you know how well you&rsquo;re able to do so. Observability
helps you find the needle in the haystack, identify the issue and respond before
your customers are affected.</p>
<p>Pillars of observability:</p>
<dl>
<dt>Metrics</dt>
<dd>Numeric values measured over time. Easy to query and retained for longer periods.</dd>
<dt>Logs</dt>
<dd>Records of events that occurred at a particular time (plain text, binary,
etc). Used to understand the system and what&rsquo;s going on.</dd>
<dt>Traces</dt>
<dd>Represent the end-to-end journey of a user request through the subsystems of
your architecture.</dd>
</dl>
<p>Relevant key performance indicators (KPIs) and key result areas (KRAs):</p>
<ul>
<li>Customer experience</li>
<li>Mean time to repair (MTTR)</li>
<li>Mean time between failure (MTBF)</li>
<li>Reliability and availability</li>
<li>Performance and scalability</li>
</ul>
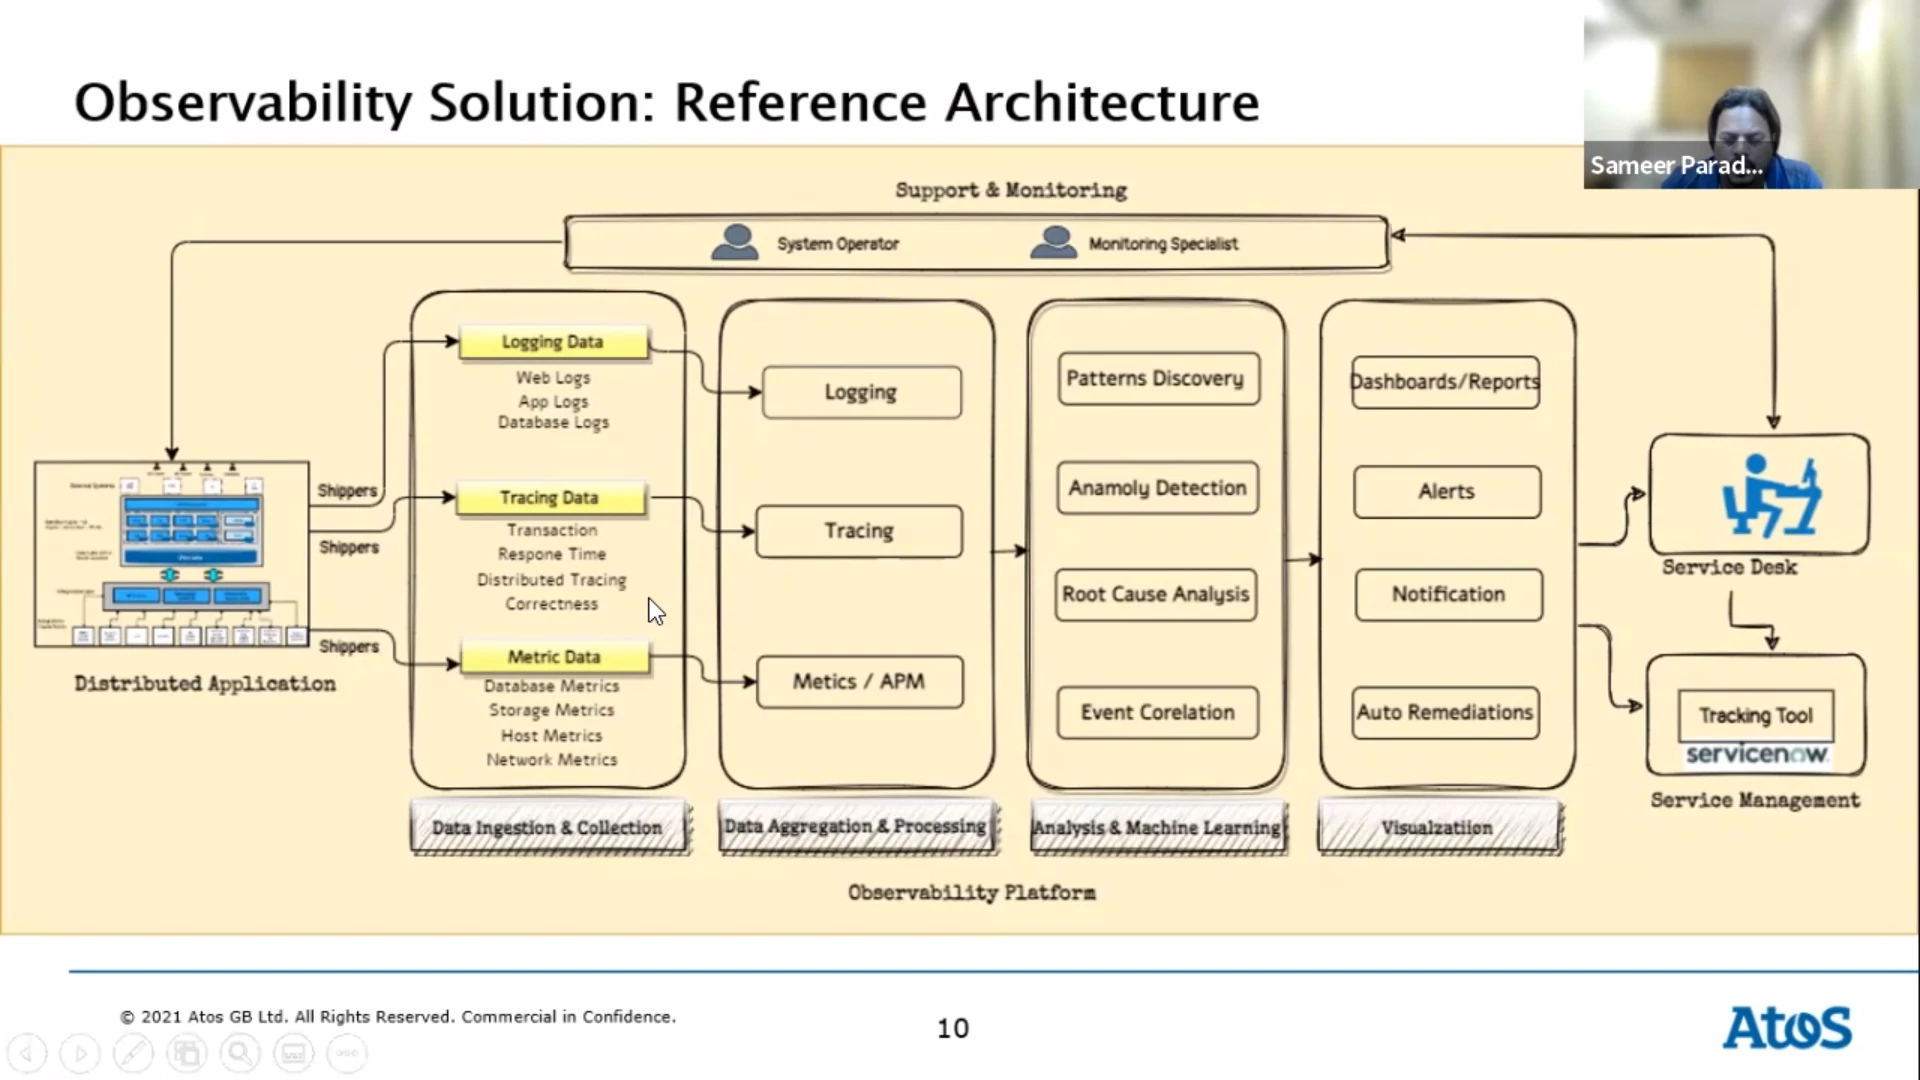
<p>An observability platform gives you more visibility into your systems health
and performance. It allows you to discover unknown issues. As a result you&rsquo;ll
have fewer problems and blackouts. You can even catch issues in the build phase
of the software development process. The platform helps understand and debug
systems in production via the data you collected.</p>
<p><img src="/images/all_day_devops_2022_sameer_paradkar.webp" alt="Sameer Paradkar shows a reference architecture of an observability solution"></p>
<p>AIOps applies machine learning to the data you&rsquo;ve collected. It&rsquo;s a next stage
of maturity. Its goal is to create a system with automated functions, freeing up
engineers to work on other things. Automating remediation of issues can also
greatly reduce response time and mean time to repair. This means that the
customer experience is restored faster (or is never degraded to begin with).</p>
<h2 id="failure-is-not-an-option-its-a-fact--ixchel-ruiz">Failure Is Not an Option. It&rsquo;s a Fact &mdash; Ixchel Ruiz</h2>
<p>Failure can cause a deep emotional response, we can get depressed and it can
make us physically sick. On one side of the spectrum, a failure can cause harm
to other people. On the other side we could embrace failure and make things safe to
fail. Failure in IT on the project level is quite common. Failure can also
happen on a personal level.</p>
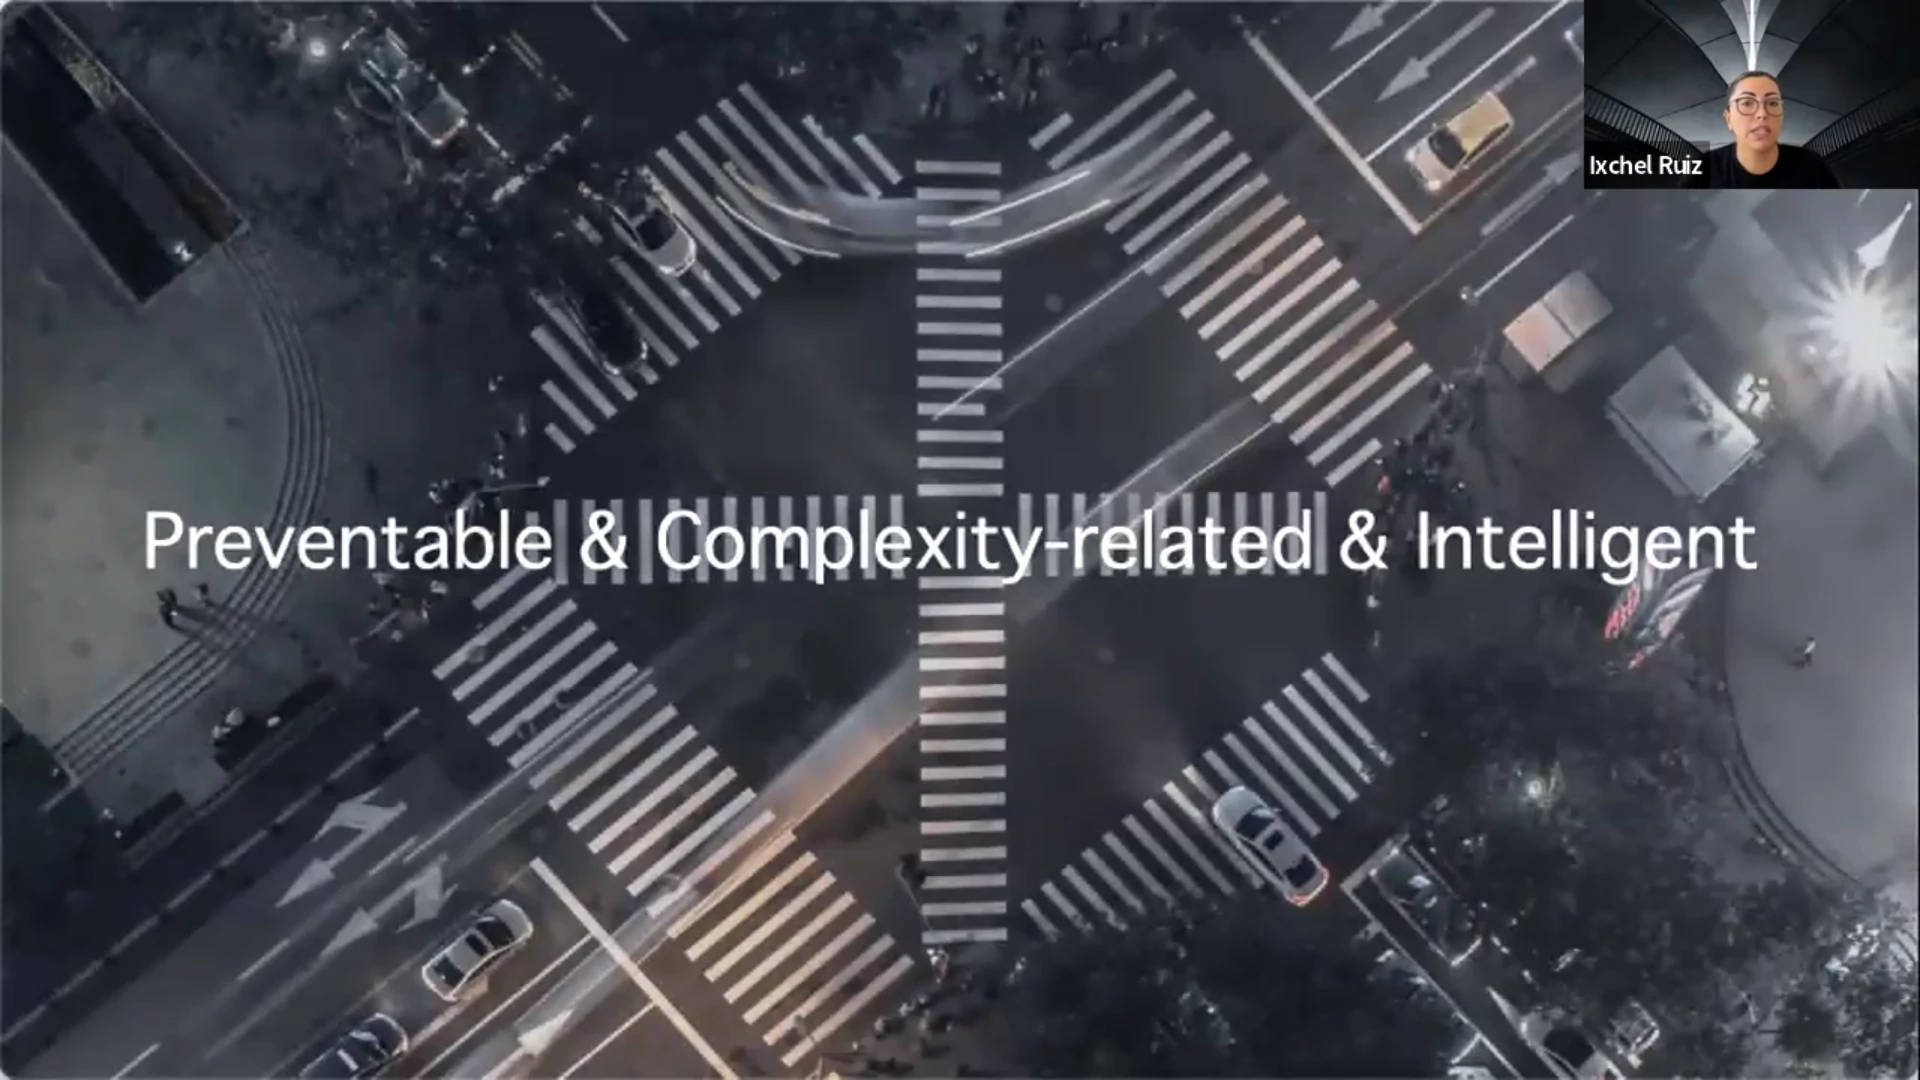
<p><img src="/images/all_day_devops_2022_ixchel_ruiz.webp" alt="Ixchel Ruiz talks about three types of errors: preventable, complexity related and intelligent"></p>
<p>Not all failures are created equally. There are three types:</p>
<dl>
<dt>Preventable</dt>
<dd>These are the &ldquo;bad&rdquo; failures. There&rsquo;s no reason to allow these.</dd>
<dt>Complexity related</dt>
<dd>These failures are due to the inherent uncertainty of work. Usually it is a
particular combination of needs, people and problems that cause them.</dd>
<dt>Intelligent</dt>
<dd>The &ldquo;good&rdquo; failures, since they provide new knowledge.</dd>
</dl>
<p>Steps to learn from failures:</p>
<ul>
<li>Recognize</li>
<li>Understand the cause</li>
<li>Extract lessons to prevent future failure</li>
<li>Share the information</li>
<li>Practice for the next failure in a safe and controlled setting</li>
</ul>
<p>Increase return by learning from every failure, share the lessons and review the
pattern of failures. Do note that none of this can happen in an environment without
psychological safety. You need to feel safe to discuss your failure, doubts or
questions to be able to learn.</p>
<h2 id="accurate-metrics--christina-zeller-and-marcus-crestani">Accurate Metrics &mdash; Christina Zeller and Marcus Crestani</h2>
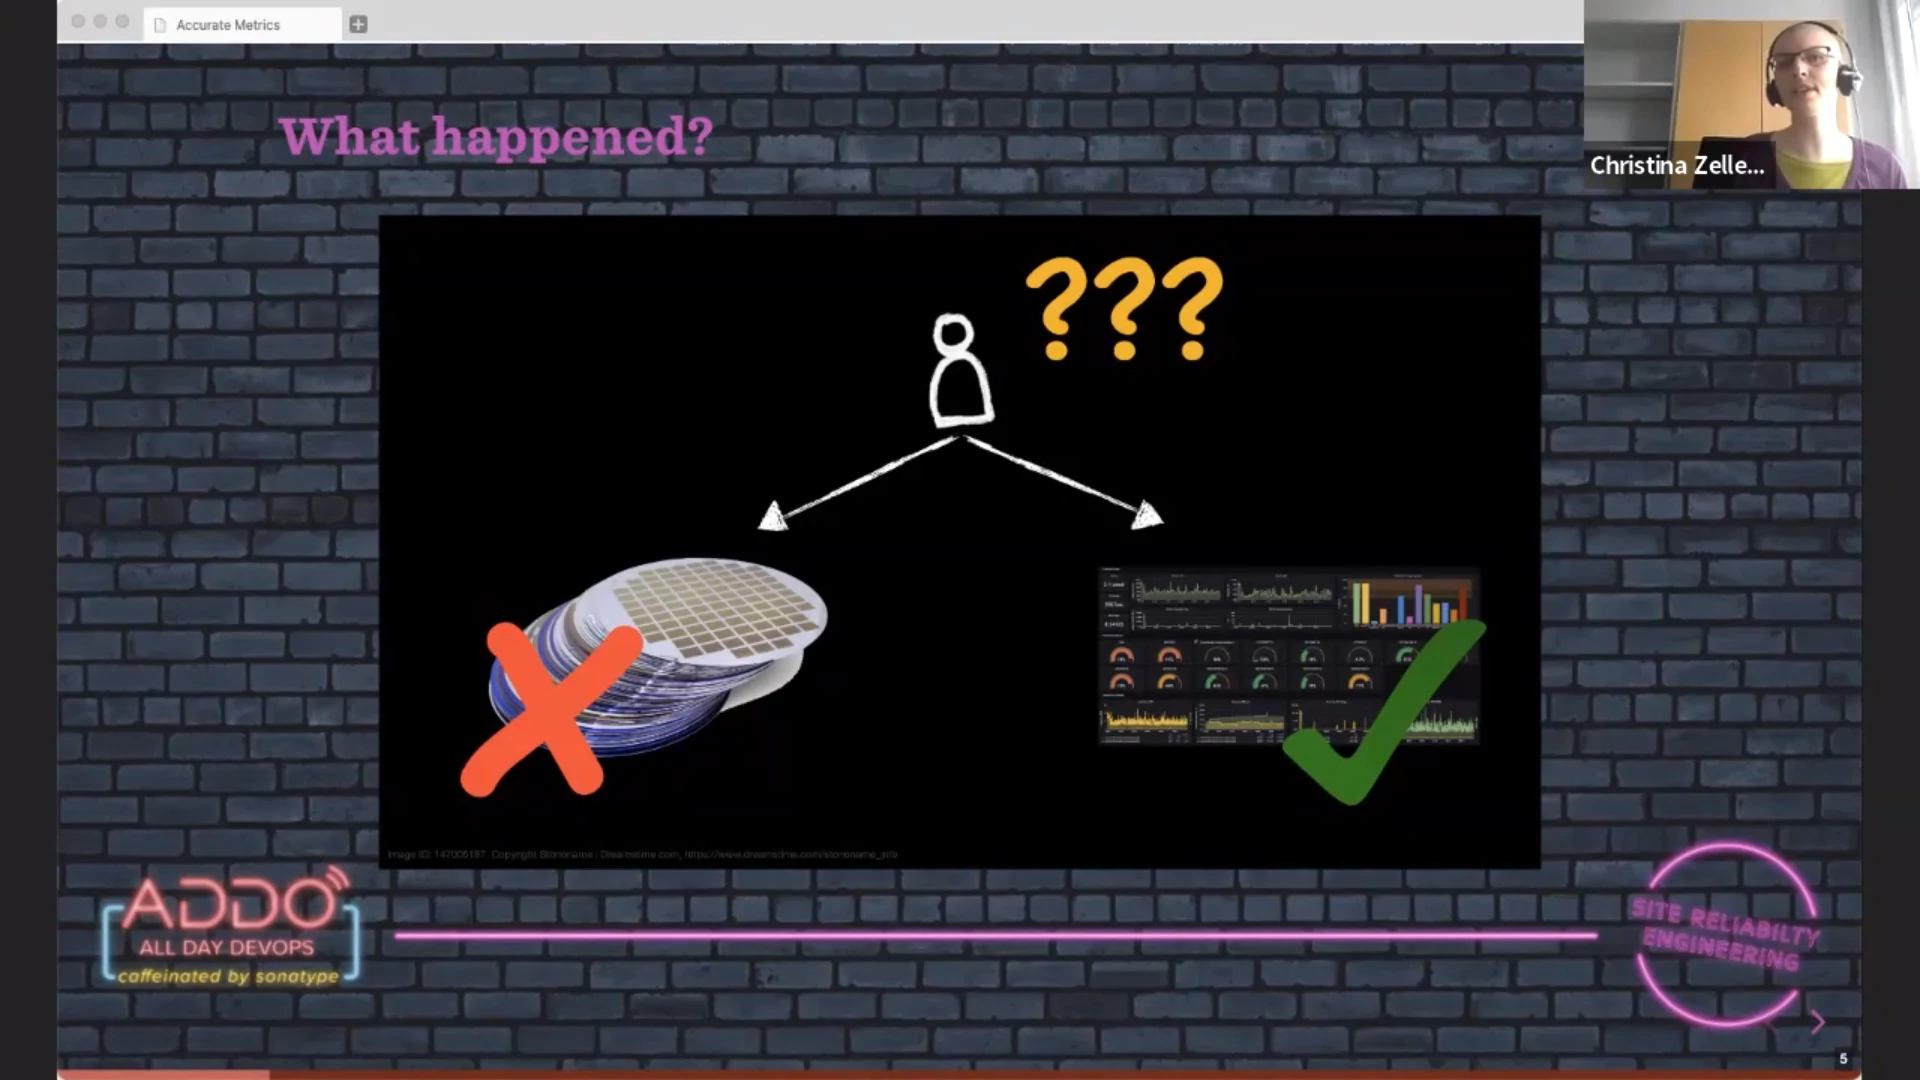
<p>A manufacturing process was monitored and there was a nice dashboard to show
whether there were any problems. However, at a certain moment there was a
problem, but the dashboard was still claiming everything was fine.</p>
<p><img src="/images/all_day_devops_2022_christina_zeller.webp" alt="Christina Zeller explaining the problem that the monitoring system did not detect a problem"></p>
<p>What was going on? Unreliable network? Erratic monitoring system? Flawed
collection of metrics? It turned out to be <em>all of them</em>.</p>
<p>Sampling rates, retention policy and network issues can cause missing
measurements in your time series database. This missing information can cause a
drop in failure rate if you are unlucky enough that the missing samples are
failed ones. So you <em>think</em> everything is fine, but there is something wrong in
your environment.</p>
<p>Modelling metrics differently can help. One possible improvement is to have a
duration <em>sum</em> in your metrics instead of just the duration. If you now miss a
sample, the sum will still indicate that there has been a failure.</p>
<p>Using histograms is even better since you place values in buckets, e.g. failures
in our case. A disadvantage however is that the metrics creation system must now
also know what qualifies as a success or failure.</p>
<p>Takeways:</p>
<ul>
<li>Always collect metrics</li>
<li>Check that your metrics match reality</li>
<li>Always consider missing data</li>
<li>For duration metrics always use histograms</li>
</ul>
<p>After improving their metrics, the monitoring system matches the actual state of
the manufacturing environment again.</p>
<p>Tip: look into <a href="https://en.wikipedia.org/wiki/Hexagonal_architecture_(software)">hexagonal
architecture</a>,
also known as &ldquo;ports and adapters architecture.&rdquo;</p>
<h2 id="why-is-it-always-dns-tls-and-bad-configs--philipp-krenn">Why Is It Always DNS, TLS, and Bad Configs? &mdash; Philipp Krenn</h2>
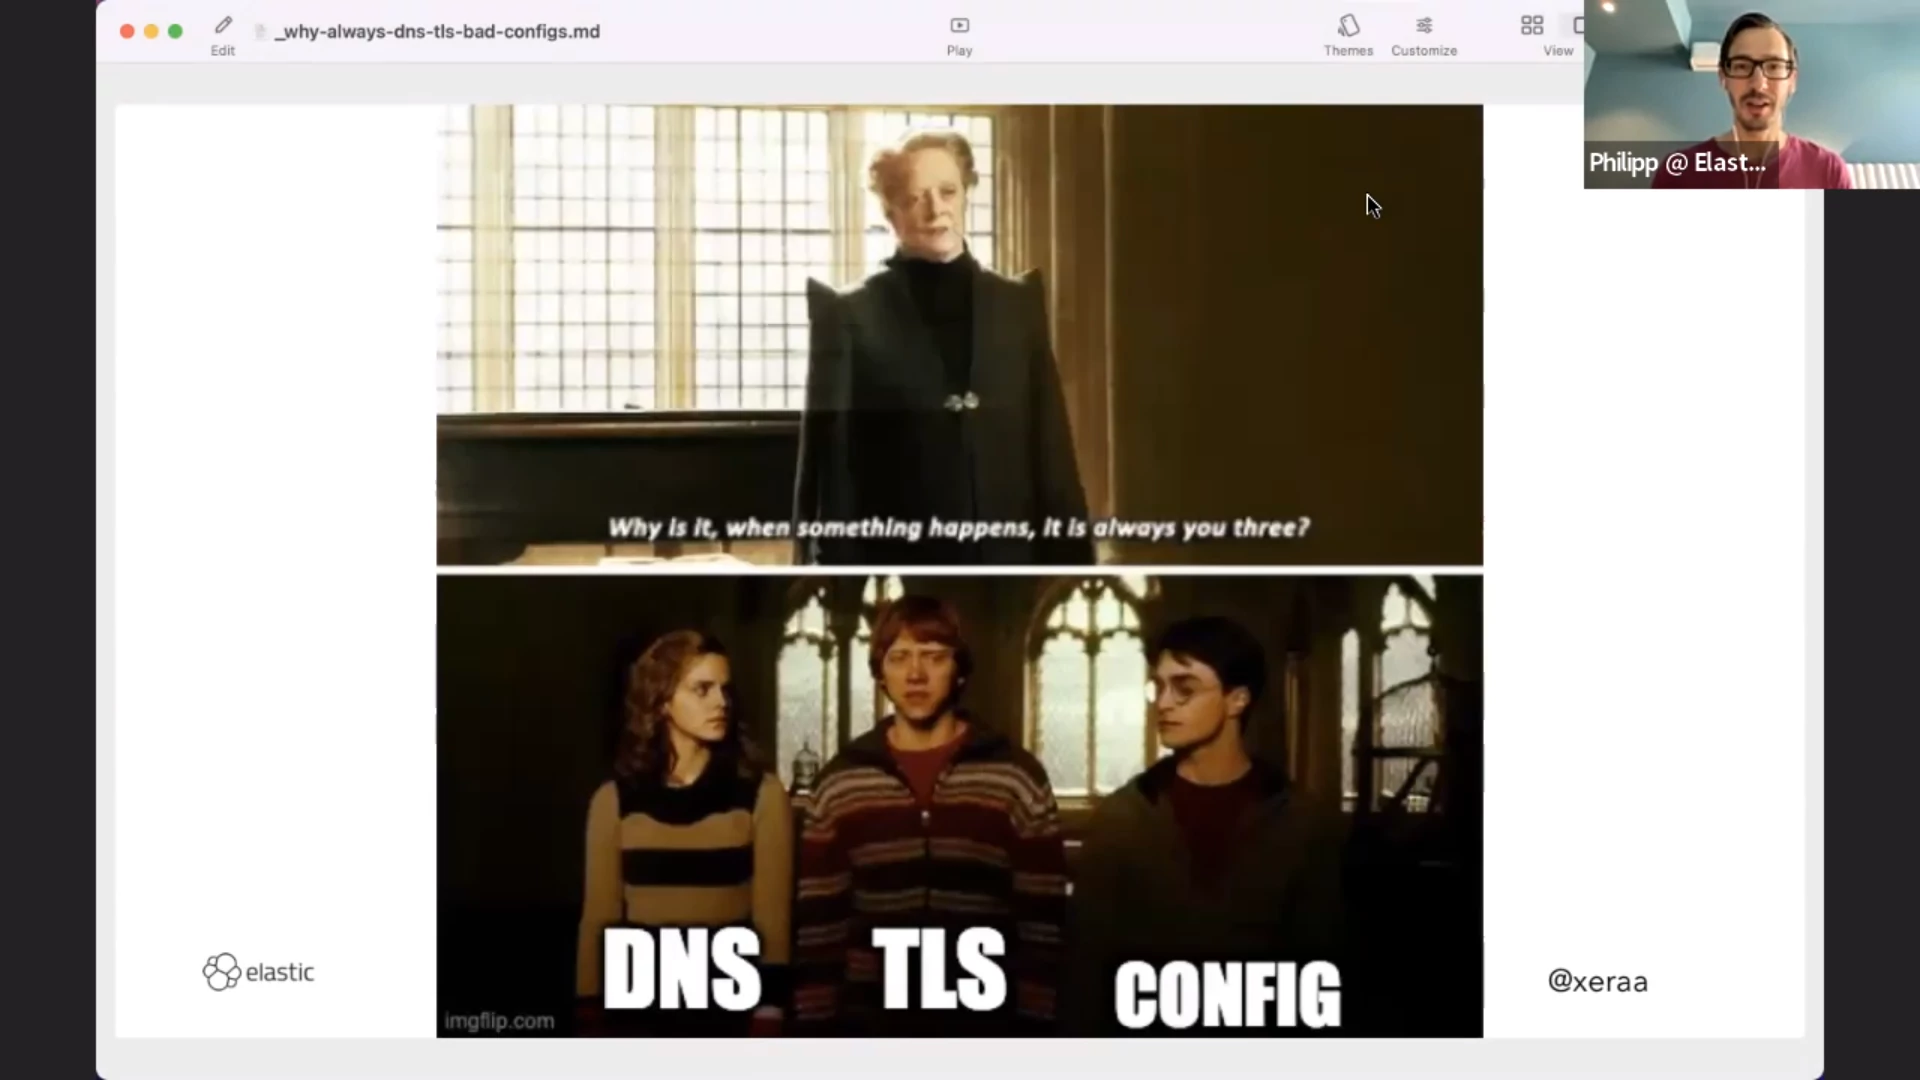
<p><img src="/images/all_day_devops_2022_philipp_krenn.webp" alt="Philipp Krenn compares DNS, TLS and bad config with the three main characters in the Harry Potter series: when something bad happens, at least one of them is always involved"></p>
<p>DNS, TLS and bad config are where failures are waiting to haunt us when we least
expect it. We need to have a tool to find the issues in our system early on.
Health checks can be this essential tool to alert us.</p>
<p>You are able to narrow down where the issue is if you structure your health
checks like this:</p>
<dl>
<dt>Outside the network (different provider)</dt>
<dd>This allows you to detect issues with e.g. DNS, the uplink, a firewall, a load
balancer, service availability and latency.</dd>
<dt>On the network (different AZ)</dt>
<dd>If you are on the network, you could see issues with the network, firewall,
TLS, service availability and latency. You can compare your measurements from
outside with what you see on the inside.</dd>
<dt>On the instance</dt>
<dd>Again, by comparing the local point of view with the outside, you can detect
issues with service availability, proxy vs service, latency, dependencies
(e.g. a database that is slow or the service cannot reach)</dd>
</dl>
<p>Examples of tests you can use:</p>
<ul>
<li>Ping a host</li>
<li>Setup a TCP connection</li>
<li>Do an HTTP request</li>
<li>POST data to a service</li>
<li>Synthetic monitoring where you simulate button clicks</li>
</ul>
<p>Health checks are cheap to run and give you a fast overview. They <strong>do not</strong>
replace observability and only tell you something is broken, not what is going
on. Start simple and only add synthetics when/where needed since they more
complex.</p>
<h2 id="comprehending-terraform-infrastructure-as-code-how-to-evolve-fast--safe--anton-babenko">Comprehending Terraform Infrastructure as Code: How to Evolve Fast &amp; Safe &mdash; Anton Babenko</h2>
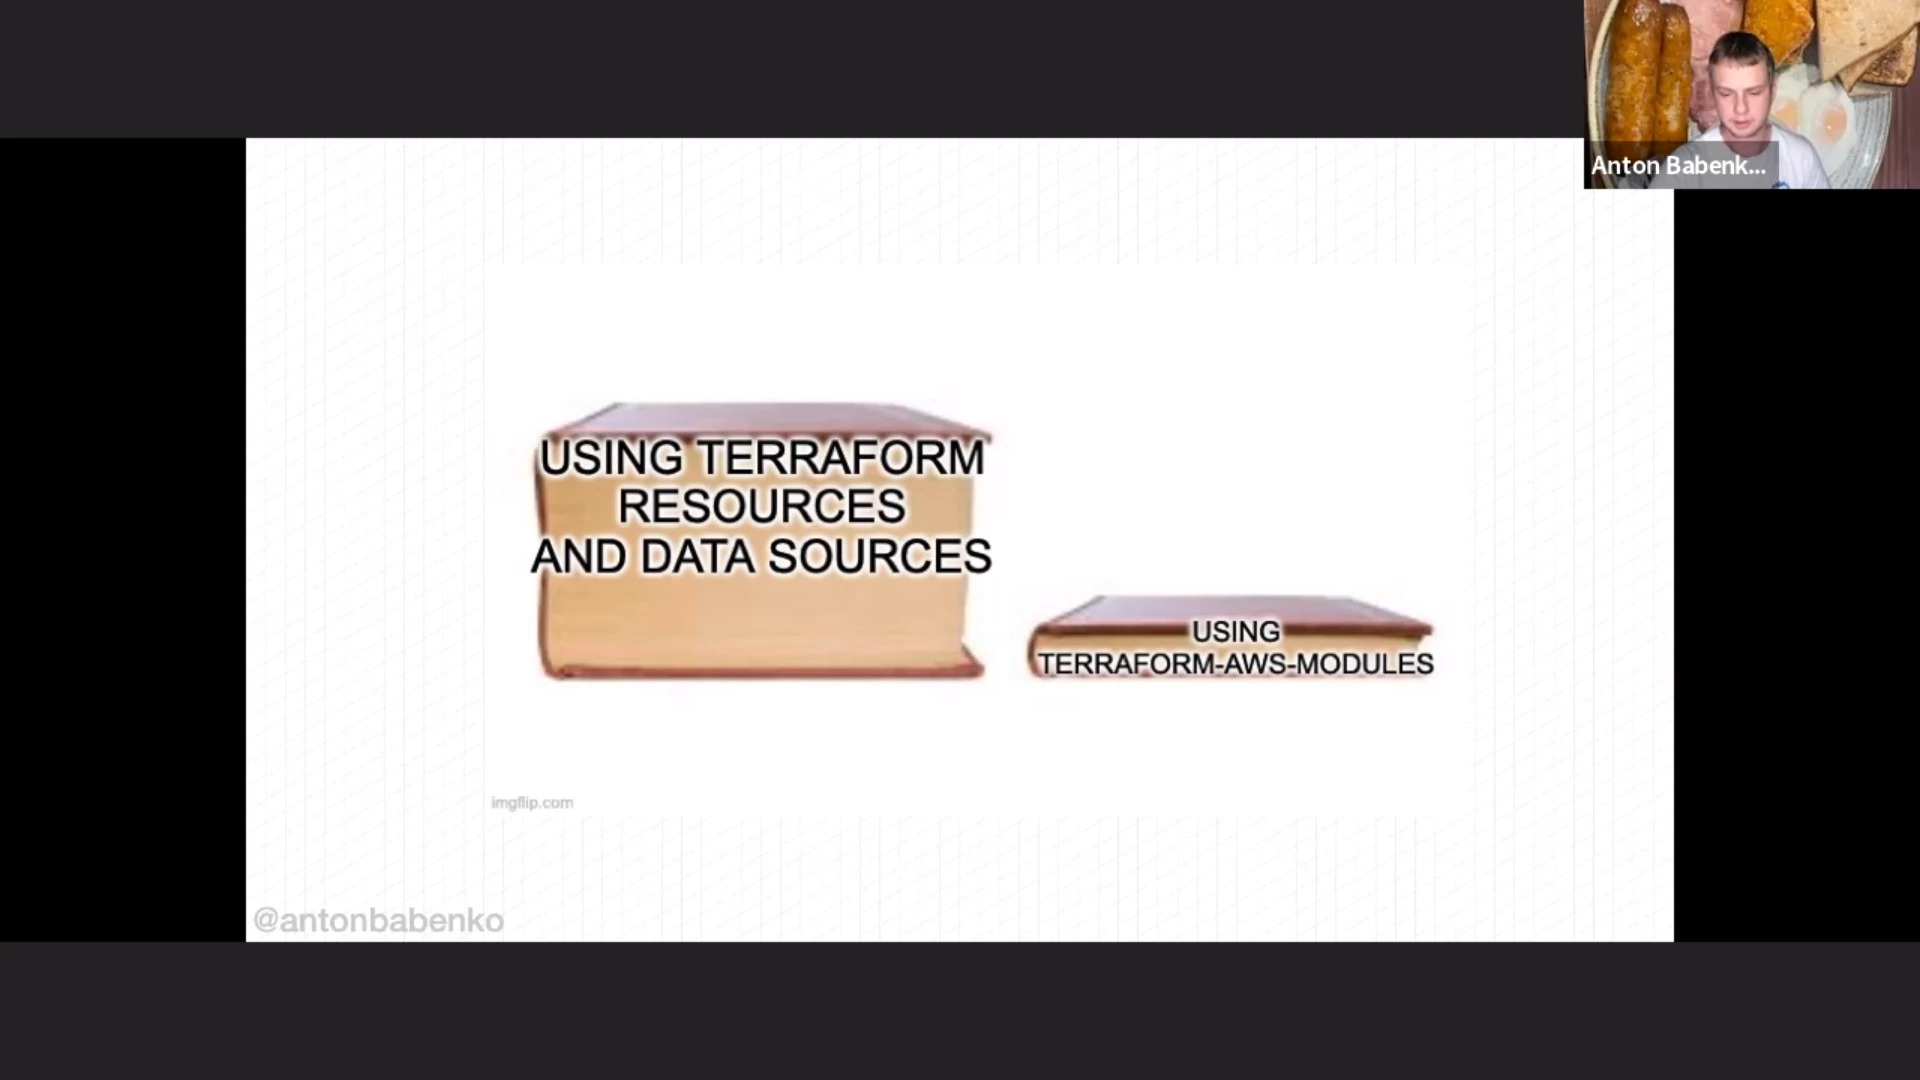
<p>By using <a href="https://registry.terraform.io/namespaces/terraform-aws-modules">Terraform AWS modules</a>
you&rsquo;ll have to write less Terraform code yourself, compared to using the
AWS provider resources directly.</p>
<p><img src="/images/all_day_devops_2022_anton_babenko.webp" alt="Anton Babenko compares writing all Terraform code yourself in one big book with using terraform-aws-modules which results in a smaller book"></p>
<p>For example: if you write your own Terraform code from scratch for an example
infrastructure with 40 resources, you&rsquo;ll need about 200 lines of code. Once you
introduce variables, that code base will grow to 1000 lines of code. When you
then split it up into modules, you&rsquo;ll need even more code.</p>
<p>Instead, if you use <code>terraform-aws-modules</code> you&rsquo;ll have more features than your
own modules would only need about 100 lines of code.</p>
<p>Questions with regard to <code>terraform-aws-modules</code>:</p>
<dl>
<dt>Why?</dt>
<dd>Understandability is an important issue. To help with these questions (like
&ldquo;why is it done this way?&rdquo;) there are autogenerated documentation and diagrams. A
visualization of the dependencies also helps.</dd>
<dt>Does it work?</dt>
<dd>The project focusses on static analysis (using <code>tflint</code> and
<code>terraform validate</code>) and running Terraform on examples. Anton thinks that testing
code should be for humans (so HCL is better than Go).</dd>
<dt>How to get feedback quicker?</dt>
<dd>Options: run Terraform locally instead of in CI/CD pipeline, simplify the
code, and restrict surface area of your code using policies, guardrails, etc.
Split up your Terraform code, with different states, to speed up Terraform
runs.</dd>
</dl>
<p>Most important word for this talk: <strong>understandability</strong>.</p>
<blockquote>
<p>50-67% of time for software projects spent on maintenance.</p></blockquote>
<p>Some useful links Anton listed:</p>
<ul>
<li><a href="https://github.com/terraform-community-modules">terraform-community-modules</a></li>
<li><a href="https://github.com/terraform-aws-modules">terraform-aws-modules</a></li>
<li><a href="https://github.com/antonbabenko/terraform-aws-devops">Various links to Anton&rsquo;s Terraform, AWS, and DevOps projects</a></li>
<li><a href="https://github.com/antonbabenko/pre-commit-terraform">Collection of git hooks for Terraform</a></li>
<li><a href="https://serverless.tf">Doing serverless with Terraform</a></li>
<li><a href="https://www.terraform-best-practices.com/">www.terraform-best-practices.com</a></li>
<li><a href="https://www.youtube.com/channel/UCGH0yYPvlCN1VjSFMGVmFgQ">Your weekly dose of #Terraform by Anton</a></li>
<li><a href="https://weekly.tf/">Terraform weekly</a></li>
<li><a href="https://twitter.com/antonbabenko">Anton on Twitter (@antonbabenko)</a></li>
<li><a href="https://lepiter.io/feenk/developers-spend-most-of-their-time-figuri-9q25taswlbzjc5rsufndeu0py/">Developers spend most of their time figuring the system out</a></li>
<li><a href="https://diagrams.mingrammer.com/">Diagram as Code</a></li>
<li><a href="https://github.com/contentful-labs/terraform-diff">terraform-diff</a></li>
<li><a href="https://github.com/terraform-compliance/cli">terraform-compliance</a></li>
<li><a href="https://localstack.cloud/">LocalStack</a></li>
</ul>
<h2 id="keynote-journey-to-auto-devsecops-at-nasdaq--benjamin-wolf">Keynote: Journey to Auto-DevSecOps at Nasdaq &mdash; Benjamin Wolf</h2>
<p>Why DevOps? It can be pretty complicated to explain, even though it is an
obvious choice for Nasdaq. For most people Nasdaq is a stock exchange but it is
actually a global technology company. Sure, they run the stock exchange, but
also provide capital access platforms and protect the financial system.</p>
<p>Nasdaq develops and delivers solutions (value) for their users. They manage and
operate complex systems. It has been around for a while. So again, why DevOps?
The answer is: to get better at their practices.</p>
<ul>
<li>They want to deliver solutions (value) to their users <strong>efficiently, reliably and safely</strong>.</li>
<li>They want to manage and operate complex systems <strong>efficiently, reliably and safely</strong>.</li>
</ul>
<p>Years ago they had manually configured static servers and the development teams
were growing. They automated software deployment to a point where the product
owners could trigger the deployment, and even pick which branch to deploy. This
was an important <strong>first evolution</strong>. They had a &ldquo;DevOps team&rdquo; to handle this
automation.</p>
<p>The <strong>second evolution</strong> for Nasdaq was moving from a data center to the cloud,
using infrastructure as code (IaC). The question they asked themselves was what
to do first: migrate to cloud or get their data center infrastructure 100%
managed via IaC? They made the ambitious decision to do both at once.</p>
<p>By turning your infrastructure into code, you can create and destroy the
environment as many times as you like. And this was welcome: after about 2100
times they &ldquo;got it right&rdquo; and were able to move over the production environment
to the cloud. Without IaC this would not have been possible as flawlessly as it
did.</p>
<p>The cloud and IaC brought them:</p>
<ul>
<li>Efficiency: maintenance, patching, capacity</li>
<li>Reliability: self-healing, immutable</li>
<li>Safety: immutability, destroy/create</li>
</ul>
<p>Over time the DevOps team started to handle a lot more work. The team consisted
of system administators, but they were required to work as developers (make code
reusable, use git, etc). The DevOps team started to complain about being
overloaded and they became a bottleneck since a lot of development teams came to
them with problems (failing builds, cloud questions).</p>
<p>On the other side, the development teams stared to complain because they are
dependent on the DevOps team but that team had become the bottleneck. And &ldquo;just&rdquo;
scaling up the DevOps team would not solve the problem.</p>
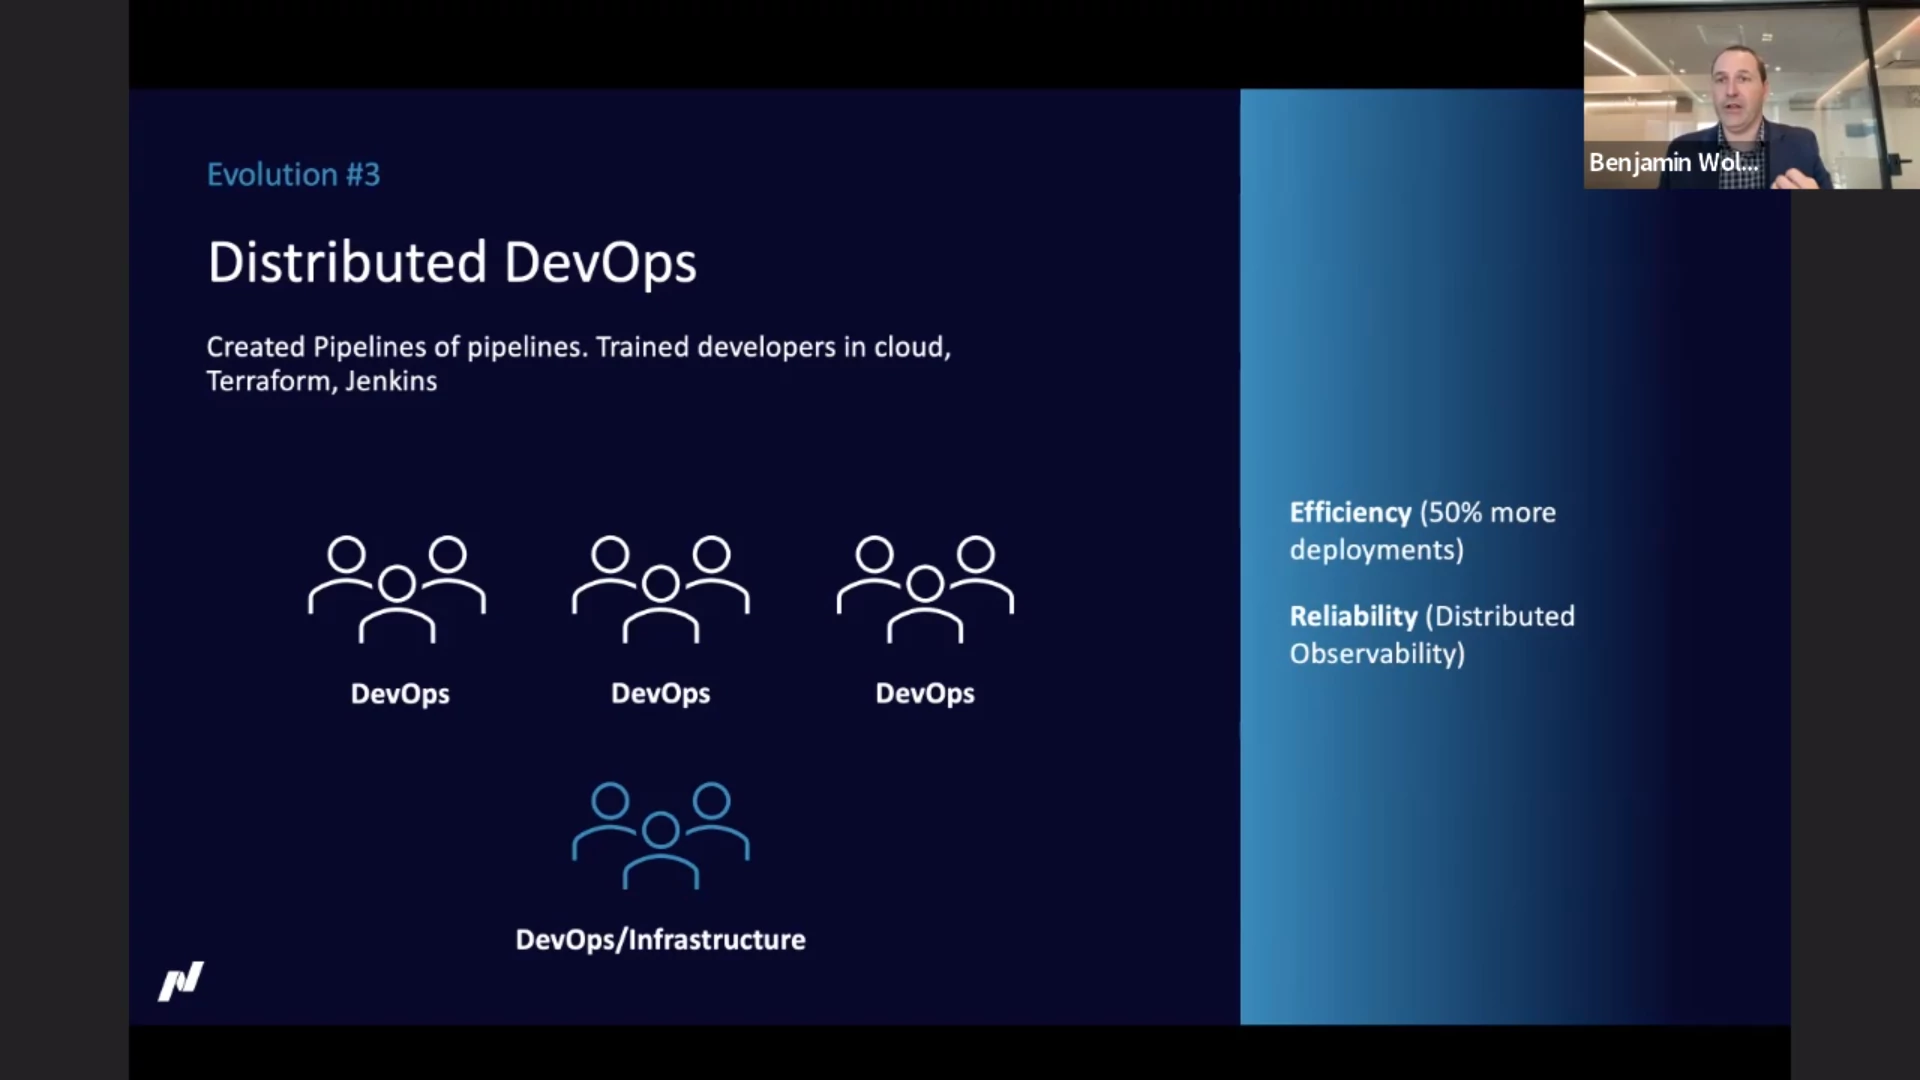
<p>Where the second evolution was about the technology, the <strong>third evolution</strong> was about
efficiency. They moved to a &ldquo;distributed DevOps&rdquo; model. Developers were
empowered: access to logs and metrics, training (cloud, Terraform, Jenkins). By
creating a central observability platform, developers could get insight in what
is going on, without the need to have access to the production environment.</p>
<p>This resulted in more deployments and enhanced reliability of the deployments
because of the observability platform.</p>
<p><img src="/images/all_day_devops_2022_benjamin_wolf_1.webp" alt="Benjamin Wolf about their third evolution"></p>
<p>A year or three later, new cracks appeared. Standards were diverging because
teams were allowed to pick their own path (libraries, databases, pipelines,
Terraform code, etc). It also lead to practices that needed to be fixed (e.g.
lack of replication). Standardizing this led to quite a burden at the start of a
project: lots of basic stuff to setup.</p>
<p>Developers needed to be experts in a lot of technology, from JavaScript and the
JavaScript framework in use, via multiple .NET versions to Terraform and other
deployment related tech. An easy way to solve this situation was to flip back to
the previous situation with a single team responsible for deployment and such.
But this would basically mean recreating the bottleneck.</p>
<p>The ownership itself was not the problem. The efficiency was, because of the
boilerplate needed for teams. Stuff you want to do the same across the teams.
They wanted to empower the development teams, but also give them the standards
for databases, messaging, etc. Instead of copying a template and have teams
diverge afterwards, they looked into packaging to also make it easier to update
afterwards.</p>
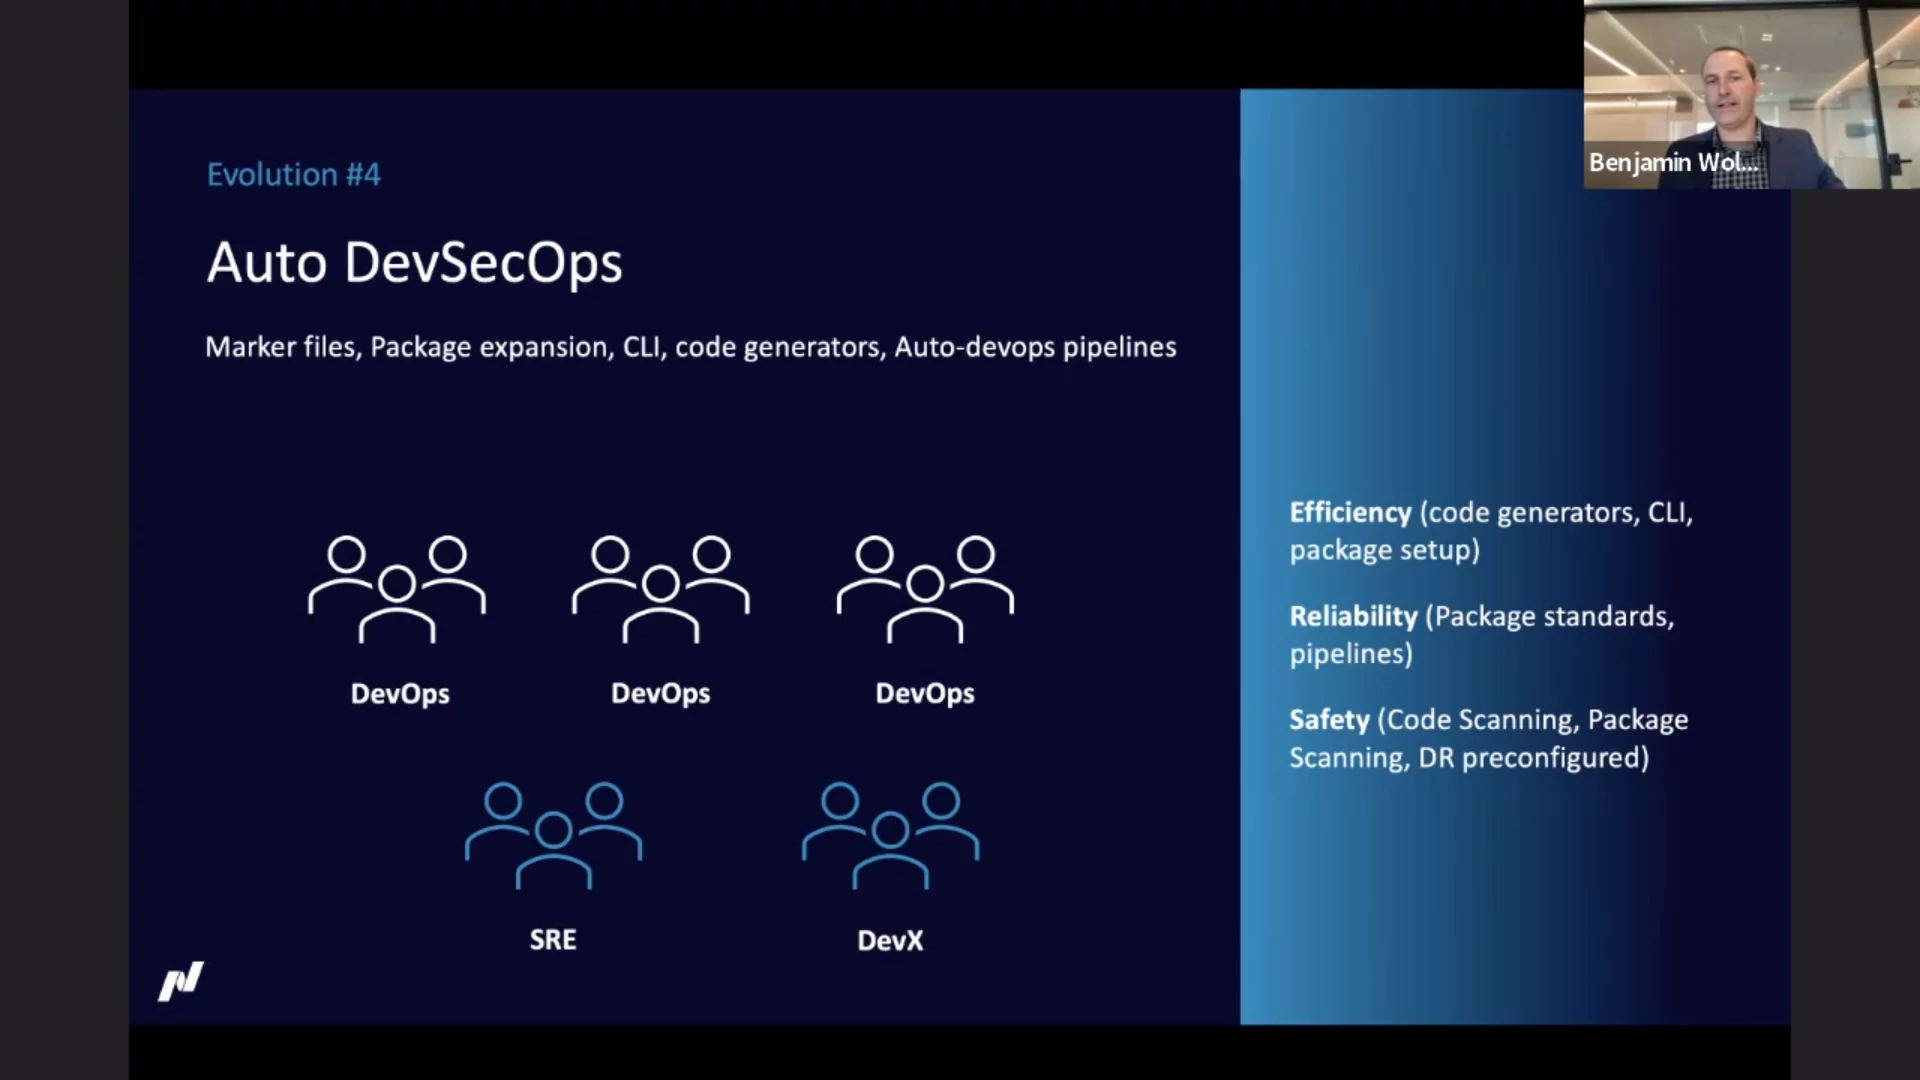
<p>This lead to <strong>evolution four</strong> with marker files, packages, code generators and
auto-devops pipelines. The pipeline looks at the markers (&ldquo;hey, this is a .NET
app&rdquo;) and can then apply a standard pipeline. Nasdaqs code generators create the
boilerplate for the teams so within two minutes of starting with a new
application you&rsquo;re able to write code to solve your business problem, instead of
having to create boilerplate code yourself first.</p>
<p>The developers can get up and running quickly, but in a safe way.</p>
<p>The development teams are all DevOps teams now, but Nasdaq also has a
specialized team for the complex areas (hardware, networking, etc). There is
also a &ldquo;developer experience&rdquo; team that focusses on the tools for the
developers, like the code generators.</p>
<p><img src="/images/all_day_devops_2022_benjamin_wolf_2.webp" alt="Benjamin Wolf about their fourth evolution"></p>
<p>Current status with regard to our three key areas:</p>
<ul>
<li>Efficiency: code generators, CLI, package setup</li>
<li>Reliability: package standards, pipelines</li>
<li>Safety: code scanning, package scanning, disaster recovery preconfigured</li>
</ul>
<h2 id="varieties-of-incident-response--kurt-andersen">Varieties of Incident Response &mdash; Kurt Andersen</h2>
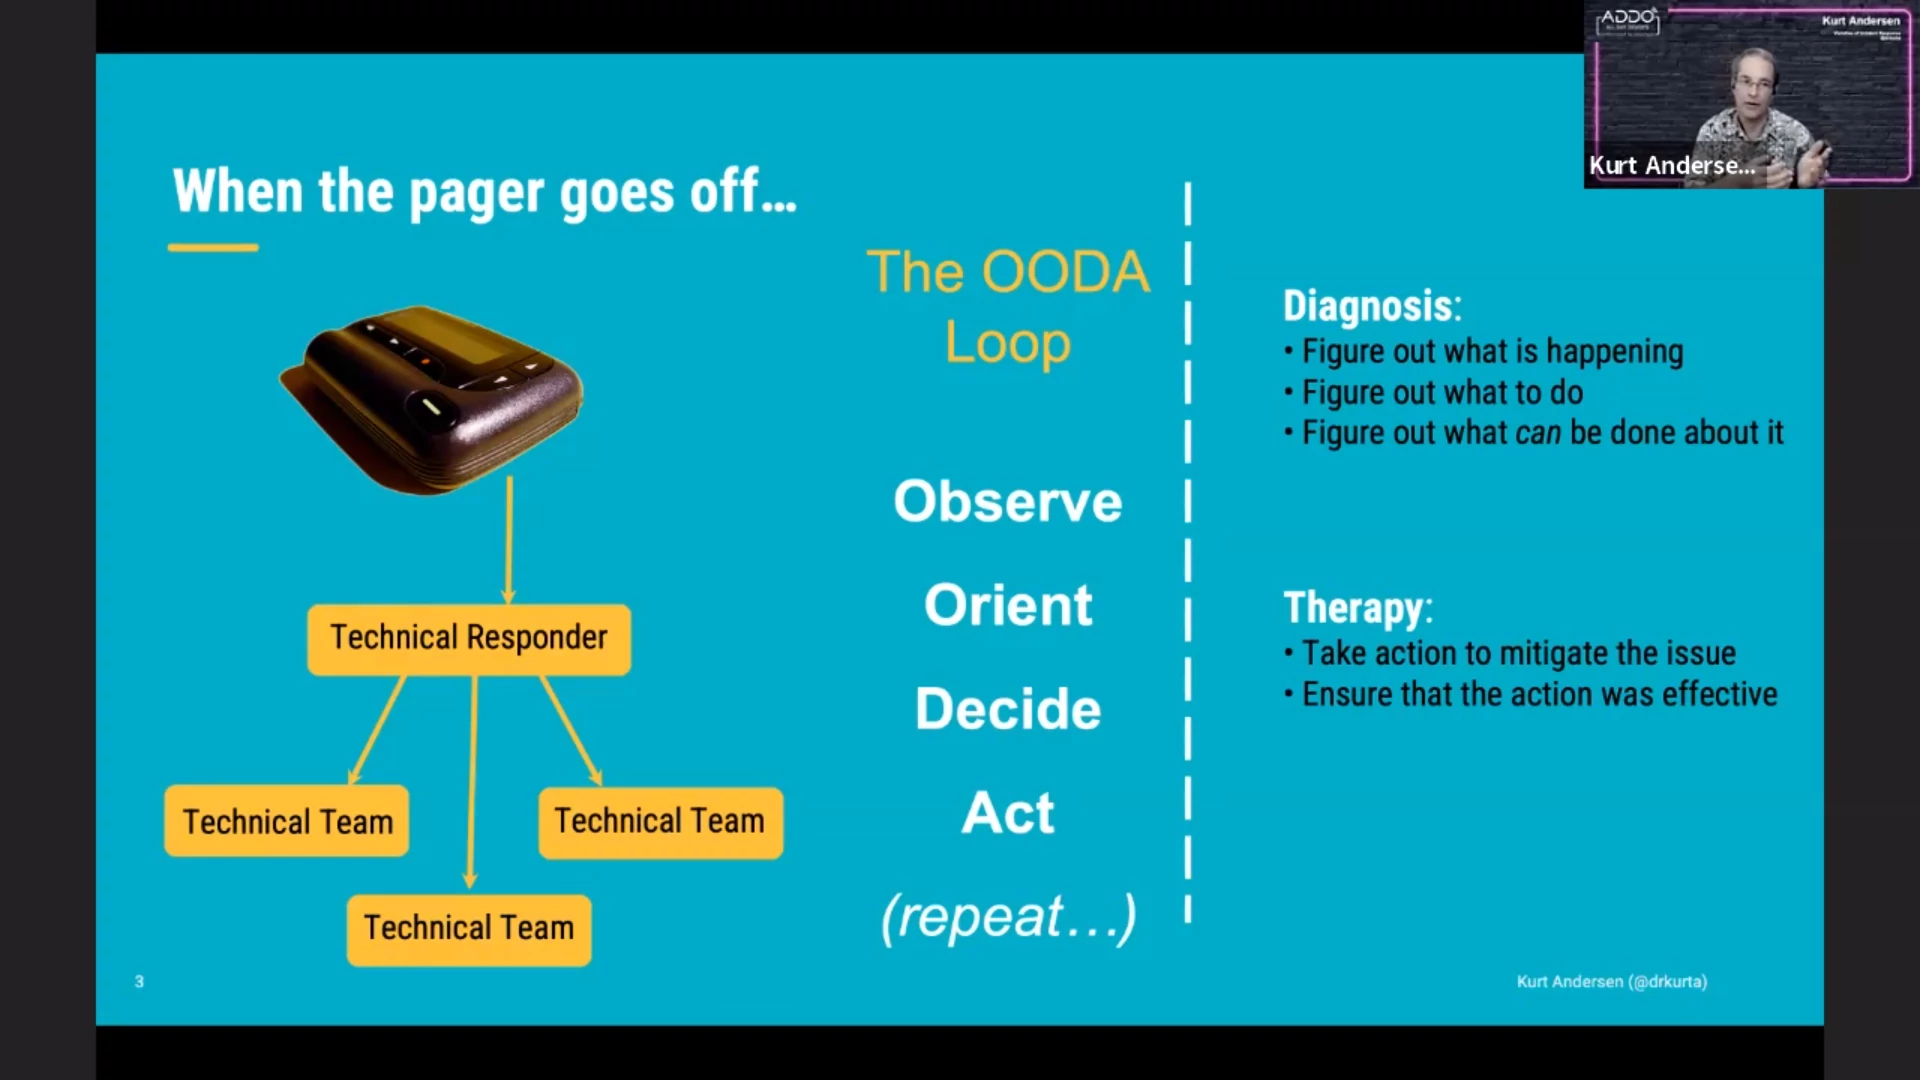
<p>No matter how reliable our systems are, they are never 100% &mdash; an incident can
always happen. When the pager goes off, the first step is to recruit a response
team. This team can then observe what is going on. They need to figure out what
this means (orient themselves) and decide what to do. And finally they can act
to resolve the problem. (The OODA loop.)</p>
<p><img src="/images/all_day_devops_2022_kurt_andersen_1.webp" alt="Kurt Andersen about basic incidence response"></p>
<p>Getting the right people involved can be hard for the technical responder; they
themselves might want to dive into the technical stuff first. This is where the
&ldquo;incident commander&rdquo; role comes in. The incident responder will recruit the team
to get the right people involved, coordinate who does what and handle
communication with people outside of the response team. (The latter can also be
handled by a dedicated &ldquo;comms lead&rdquo; if needed.)</p>
<p>But how does the incident commander get involved?</p>
<p>A fairly standard approach for an on-call system will be to have a tiered model:
tier 1 (NOC), tier 2 (people generally familiar with the system) and tier 3 (the
experts of the system having the issue). The problem with this model: where does
the incident commander come from? Tier 1? If so, can the incident commander
follow through if the issue is handed over to the next tier?</p>
<p>Another model (&ldquo;one at a time&rdquo;): team A gets involved, decides it is not their
responsibility, hands over to team B, which kicks it to team C, etc. Where does
the incident commander come from in this model?</p>
<p>The aforementioned models only work in the simplest cases. They share a few big
problems: handoffs are hard and there is no ownership, which results in loss of
context. To mitigate this, some teams have an &ldquo;all hands&rdquo; approach where
everyone is paged and everyone swarms into the incident response. However, most
people on the call (or in the war room) cannot contribute. This leads to a
mentality of &ldquo;how quickly can I get out of here?&rdquo;</p>
<p>Yet another approach is an Incident Command System (ICS), which comes from
emergency services. In this approach the alert goes to the incident commander
who then involves the team. While this works in some organizations, in tech it&rsquo;s
usually a bit too regimented.</p>
<p>The ICS morphed to an &ldquo;adaptive ICS&rdquo; where the technical team has more autonomy,
but the incident commander is still involved. This system can be scaled up to
where there&rsquo;s an &ldquo;area commander&rdquo; role which coordinates separate teams (via
their respective incident commanders).</p>
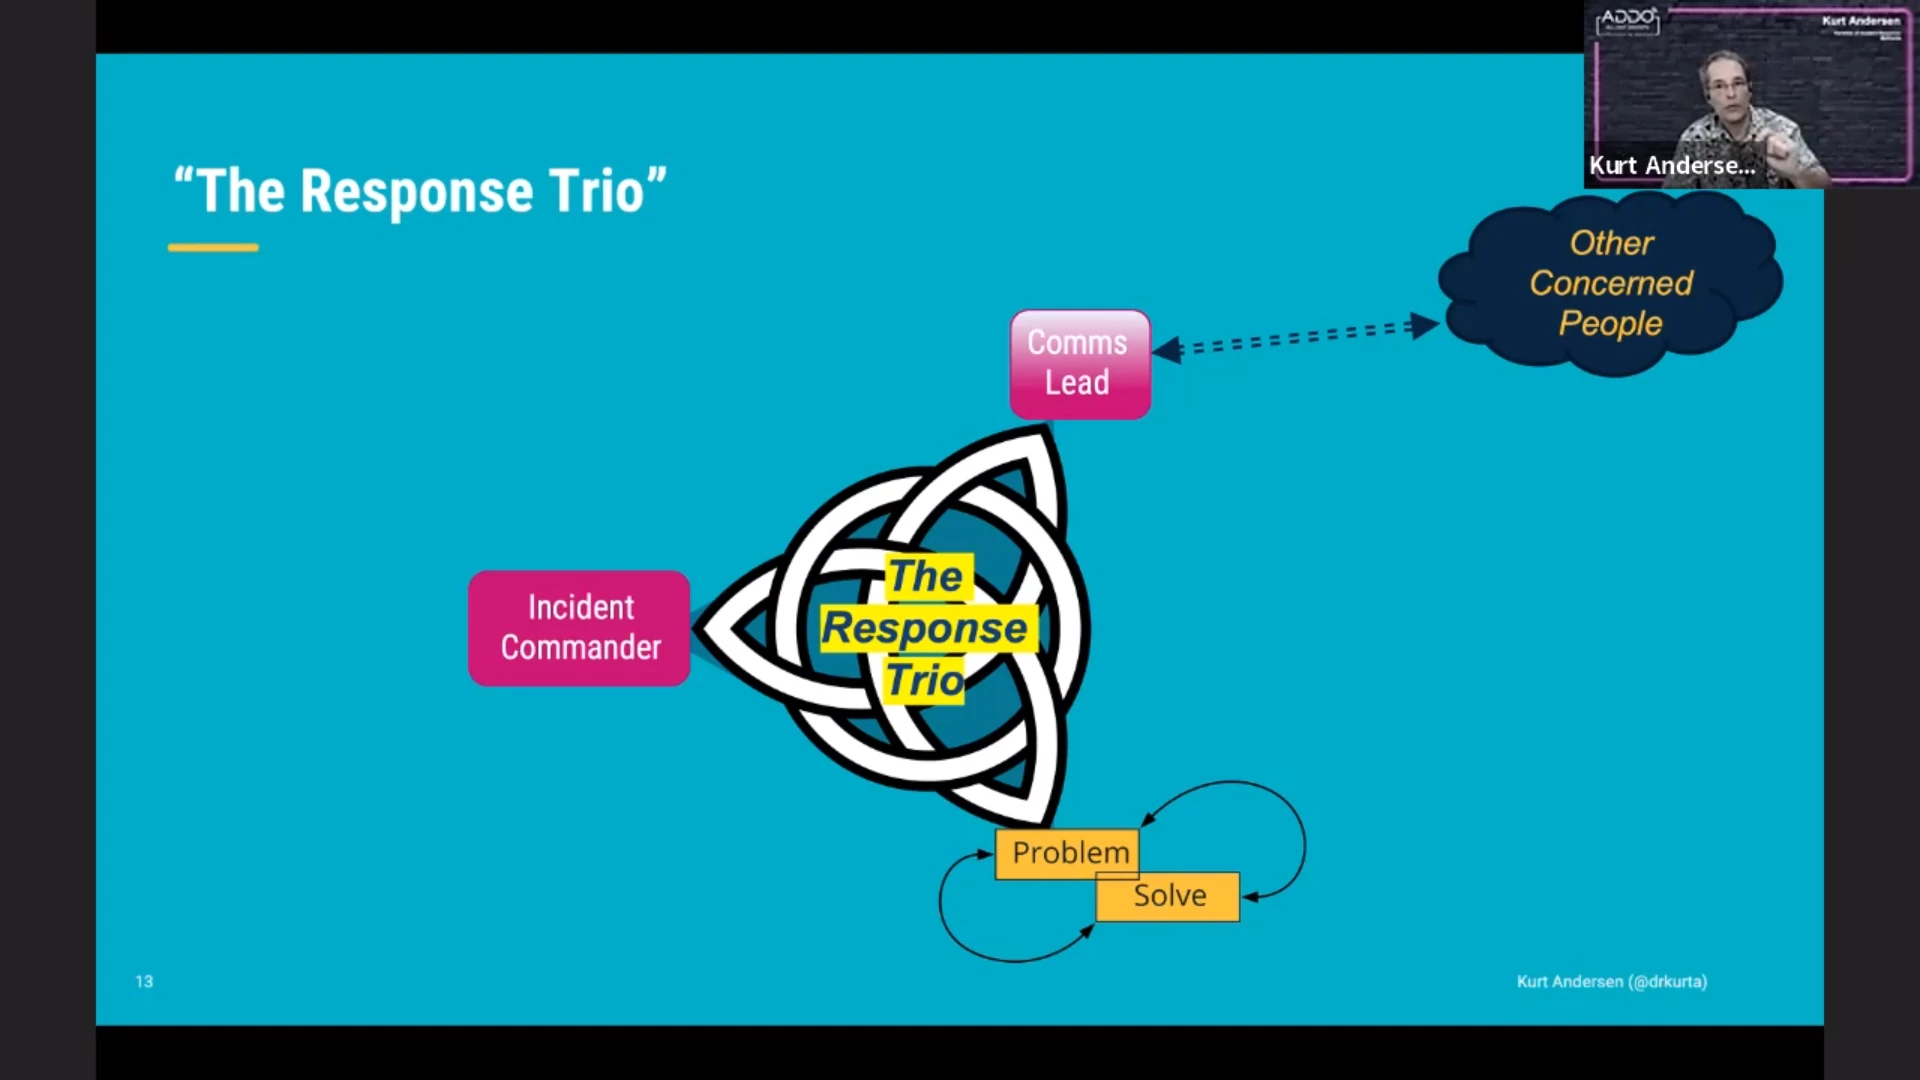
<p><img src="/images/all_day_devops_2022_kurt_andersen_2.webp" alt="Kurt Andersen with an image of the &ldquo;response trio&rdquo;"></p>
<p>Summarizing the roles of the parties in the &ldquo;response trio&rdquo;:</p>
<ul>
<li>incident commander: coordination</li>
<li>tech team: nitty-gritty to solve the problem</li>
<li>comms lead: maintain contact with stakeholders</li>
</ul>
<p>Each role will perform their own OODA loop from their own perspective.</p>
<p>But we started the story in the middle. We need to get back to the beginning and
ask the question &ldquo;why is the pager making noise?&rdquo; Perhaps the first question one
should ask is: &ldquo;is this something actionable?&rdquo; If it is not or if it is something
you can handle in the morning, perhaps you do not have to respond in the middle
of the night.</p>
<blockquote>
<p>Cut down the noise and focus on the signal.</p></blockquote>
<h2 id="the-e-stands-for-enablement---modern-sre-at-pagerduty--paula-thrasher">The E Stands for Enablement - Modern SRE at PagerDuty &mdash; Paula Thrasher</h2>
<p>PagerDuty had an idea what SRE meant: they were enablers. You can hit them up on
Slack and they help you out with a problem. Having an SRE team initially reduced
the total minutes in incident in a year. But when PagerDuty grew further, the
number went up again. Oops.</p>
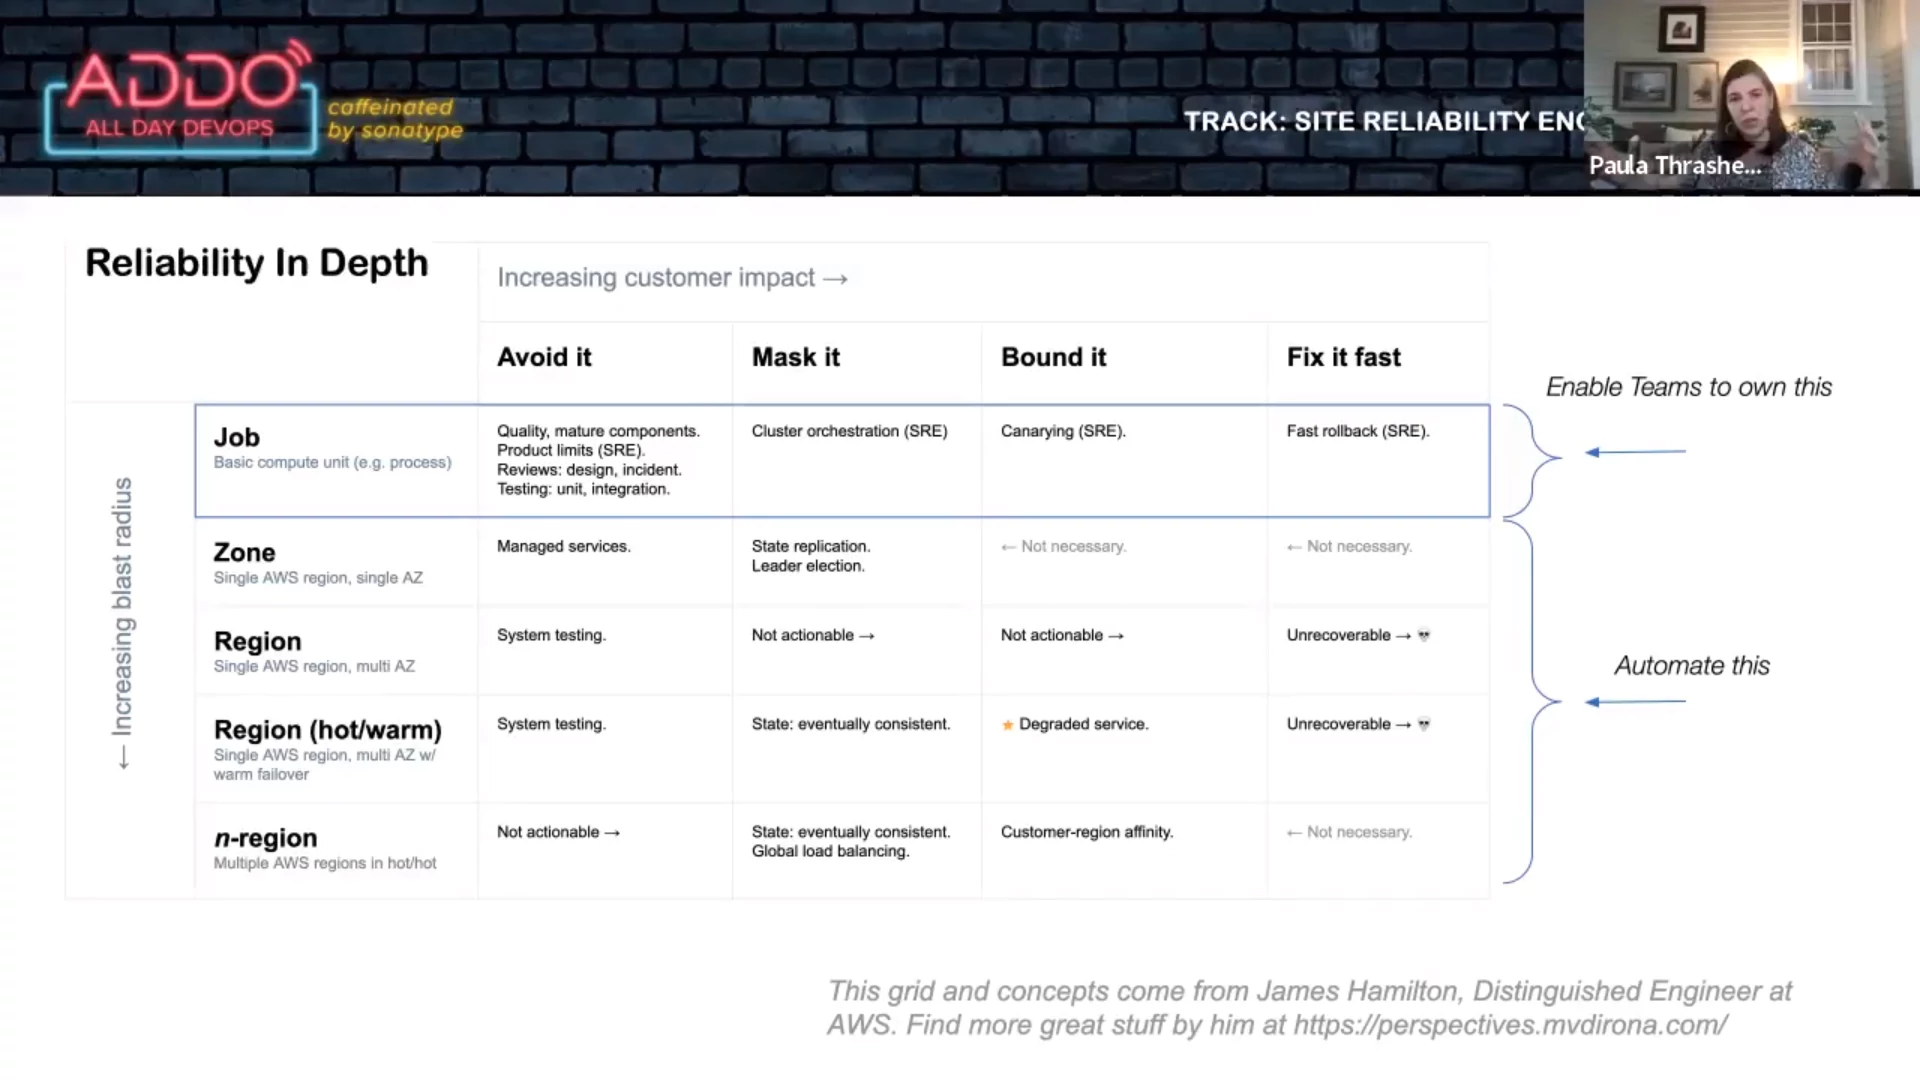
<p><img src="/images/all_day_devops_2022_paula_thrasher.webp" alt="Paula Thrasher about agreeing on who is responsible for what"></p>
<p>The &ldquo;get well&rdquo; project required teams to have the following:</p>
<ul>
<li>Fast rollbacks: all rollbacks have to happen within 5 minutes. The SRE team
provided guidelines to help teams achieve this.</li>
<li>Canary deploys: teams must test changes (canary) first. The SRE team enabled
this via tooling.</li>
<li>Product limits: reasonable limits. The SRE team made this possible via
telemetry and monitoring.</li>
</ul>
<p>Results:</p>
<ul>
<li>Lower number of minutes in major incident</li>
<li>Lower mean time to resolve</li>
<li>More &ldquo;incidents averted&rdquo;: four minor incidents were resolved before they
caused real harm.</li>
</ul>
<p>Important elements that made this &ldquo;get well&rdquo; project possible:</p>
<ul>
<li>Clear, measurable goals</li>
<li>Enabled by tools and templates</li>
<li>Gave teams a path to do it</li>
<li>Experts were available to coach</li>
<li>The teams owned the implementation themselves</li>
<li>The teams were held accountable</li>
</ul>
<p>PagerDuty used <a href="https://backstage.io">Backstage</a> as an internal &ldquo;one stop shop&rdquo;
developer portal with documentation and insights. It also integrates with the
development systems.</p>]]></content>
  </entry>
  <entry>
    <title type="html"><![CDATA[All Day DevOps]]></title>
    <link rel="alternate" href="https://markvanlent.dev/2019/11/06/all-day-devops/" type="text/html" />
    <id>https://markvanlent.dev/2019/11/06/all-day-devops/</id>
    <author>
      <name>map[name:Mark van Lent uri:https://markvanlent.dev/about/]</name>
    </author>
    <category term="aws" />
    <category term="conference" />
    <category term="culture" />
    <category term="devops" />
    <category term="observability" />
    <category term="infrastructure as code" />
    <category term="serverless" />
    <category term="sre" />
    <category term="tools" />
    
    <updated>2021-11-09T20:09:33Z</updated>
    <published>2019-11-06T00:00:00Z</published>
    <content type="html"><![CDATA[<p><a href="https://www.alldaydevops.com/">All Day DevOps</a> is an online conference
which lasts for 24 hours. With 150 sessions across 5 tracks, there&rsquo;s enough
content to consume.</p>
<p><em>(As with all my recent conference notes: these are just notes, not complete summaries.)</em></p>
<p><img src="/images/all_day_devops_2019.png" alt="All Day DevOps"></p>
<h2 id="adidoescode-where-devops-meets-the-sporting-goods-industry--fernando-cornago">#adidoescode Where DevOps Meets The Sporting Goods Industry &mdash; Fernando Cornago</h2>
<p>Adidas is a big company, about 57,000 employees. Software is also having an
impact on sports, e.g. registering your performance, etc. Is Adidas already a
software company? Definitely not, but they should start behaving as if they are.
They are building their applications 10,000 times a day.</p>
<p>New book from Gene Kim (the author of
<a href="https://itrevolution.com/the-phoenix-project/">The Phoenix Project</a>):
<a href="https://itrevolution.com/the-unicorn-project/">The Unicorn Project</a>.
Expected end of November 2019.</p>
<p>The platform you need to be able to accelerate you business should be:</p>
<ul>
<li>on demand and self-service</li>
<li>scalable and elastic</li>
<li>pay per use (which helps with the efficiency mindset)</li>
<li>transparent and measurable (observability)</li>
<li>open source + inner source</li>
</ul>
<p>To improve sales, Adidas&rsquo; platform can run where their customers are (globally)
and can scale up if needed and scale down again when possible.</p>
<p>Making use of data is key. The data is seen as a baton in a relay race and makes
its way through the teams. A large part of time consumed in creating a service
is spent at looking at the data. The data is used to train their AI systems.</p>
<p>You want to deliver value and make sure that things are working. Testing needs
to be done on the physical level (the actual products that are being sold), but
also on the virtual level: the IT platform also needs to perform and work as
expected.</p>
<p>At Adidas they went from having a couple of &ldquo;DevOps engineers&rdquo; to having a
DevOps culture in all teams. This removed bottlenecks and allowed them to grow
faster. They have substantially reduced costs and manual testing and improved
drastically on time to production.</p>
<h2 id="multi-cloud-day-to-day-devops-power-tools--ronen-freeman">Multi Cloud &ldquo;day-to-day&rdquo; DevOps Power Tools &mdash; Ronen Freeman</h2>
<p>About the relation between SRE (Site Reliability Engineering) and DevOps: SRE is
an implementation of DevOps.</p>
<p>What defines a great SRE:</p>
<ul>
<li>Quality
<ul>
<li>Be curious
<ul>
<li>Stay up to date</li>
<li>Attend events</li>
<li>Tinker with things</li>
</ul>
</li>
<li>Adapt to change (change <strong>will</strong> happen, anticipate it, monitor it, adapt
to it and prepare for the next change)</li>
<li>Learn: <q>learn fast so you may promptly begin again</q></li>
<li>Laziness: automate, but ask your self the question whether it will
actually save time or not</li>
</ul>
</li>
<li>Support
<ul>
<li>Googling is an art form</li>
<li>You&rsquo;ll learn the answer itself but also discover things in the process</li>
<li>There are numerous forums (for example: Stack Overflow, GitHub, Slack,
etc)</li>
<li>Have a daily standup</li>
<li>Pass on knowledge</li>
</ul>
</li>
<li>Tools: there are a number of areas to consider:
<ul>
<li>Code: Bash</li>
<li>Package: Docker</li>
<li>Deliver: <a href="https://concourse-ci.org/">Concourse</a></li>
<li>Platform:
<ul>
<li>Infrastructure: Kubernetes (<q>relatively simple to get started with</q>);
<a href="https://cloud.google.com/kubernetes-engine/">GKE</a> is the most mature</li>
<li>Configuration tool: Terraform</li>
</ul>
</li>
<li>Monitor: <a href="https://cloud.google.com/products/operations">Google Stackdriver</a>
(since already running on GKE)</li>
</ul>
</li>
</ul>
<p>There&rsquo;s a demo app:
<a href="https://github.com/Darillium/addo-demo">https://github.com/Darillium/addo-demo</a></p>
<h2 id="how-to-run-smarter-in-production-getting-started-with-site-reliability-engineering--jennifer-petoff">How to Run Smarter in Production: Getting Started with Site Reliability Engineering &mdash; Jennifer Petoff</h2>
<p>Software engineering is focussed on design and building, not about running the
application.</p>
<p>There are multiple places in organizations where friction occurs:</p>
<ul>
<li>Business vs development: this is addressed by Agile</li>
<li>Development vs operations: this friction is addressed by DevOps</li>
</ul>
<p>SRE is a bridge between business, development and operations.</p>
<p>Four key SRE principles:</p>
<ul>
<li>SRE needs Service Level Objectives (SLOs) with consequences</li>
<li>SREs must have time to improve the world</li>
<li>SRE teams must be able to regulate their workload</li>
<li>Failure is an opportunity to learn (having a blamelessness culture)</li>
</ul>
<p>Some terminology:</p>
<ul>
<li>Service Level Objectives (SLOs): a goal you want to achieve. For example, you
may want to set an uptime SLO, but typically you want to dig deeper, like
99.99% of HTTP requests should succeed with a &ldquo;200 OK&rdquo; response. You want to
measure something your user cares about.</li>
<li>Service Level Agreements (SLAs): these are &ldquo;handshakes between companies,&rdquo;
contractual guarantees.</li>
<li>Error budget: the gap between your SLO and perfect reliability. E.g. the
allowed downtime to still match your 99.9% uptime SLO.</li>
<li>Error budget policy: this policy describes what do you do when you have spent
your error budget. Example: no new features until within your error budget
again.</li>
</ul>
<blockquote>
<p>100% is the wrong reliability target for basically everything</p></blockquote>
<p>SRE is about balancing between reliability, engineering time, delivery speed and
costs.</p>
<p>Note that you <em>can</em> have an error budget policy without even hiring a single
SRE. You can already start with an SLO.</p>
<p>SLOs and error budgets are a necessary first step if you want to improve the
situation.</p>
<p>When talking about making tomorrow better than today, you need to address toil
(work that needs to be done that is manual, repetitive, automatable and does not
add value). If your SRE team is spending time on toil, they are basically an ops
team. Instead you want them to make the system more robust and improve the
operability of the system.</p>
<p>One way to be able to have your SRE team regulate their workload is to put them
in a different part of the organization.</p>
<p>If you want to start with SRE, start with SLOs and let your SRE team own the
most critical system first. Don&rsquo;t make them responsible for all systems at once.
Let them deal with the most important systems first. Once they have that under
control (removed toil, etc), they can take on more work.</p>
<p>You need leadership buy-in for every aspect of SRE work.</p>
<p>Aim for reliability and consistency upfront. SRE teams should consult on
architectural discussions to get to resilient systems.</p>
<p>SRE teams can benefit from automation:</p>
<ul>
<li>Eliminate toil</li>
<li>Capacity planning (auto scaling instead of forecasting)</li>
<li>To fix issues: if you can write a playbook, you can automate it.</li>
</ul>
<p>SRE teams embrace failure:</p>
<ul>
<li>Setting SLO less than 100%</li>
<li>Blamelessness at all levels</li>
<li>Learning from failure</li>
<li>Make the postmortems available so other teams can also learn from them</li>
</ul>
<p>Resources (books):</p>
<ul>
<li><a href="https://sre.google/sre-book/table-of-contents/">Site Reliability Engineering</a></li>
<li><a href="https://sre.google/workbook/table-of-contents/">The Site Reliability Workbook</a></li>
<li><a href="https://www.oreilly.com/library/view/seeking-sre/9781491978856/">Seeking SRE</a></li>
</ul>
<h2 id="everybody-gets-a-staging-environment--yaron-idan">Everybody Gets A Staging Environment! &mdash; Yaron Idan</h2>
<p>How can you give an isolated and secure staging environment for each developer?
If you follow the path Yaron&rsquo;s company (Soluto) took, prepare for a rocky
transition, getting used to new terminology when moving to Kubernetes and users
that can get upset at first.</p>
<p>Their first step: automate the entire process. The realized they needed
onboarding documentation and templates. They used Helm for the templates.</p>
<p>Deploy feature branches to the production environment. When developers open a
pull request, the CI/CD tool adds a link to where this PR is deployed. This
empowers the developers and provides a sense of security. This accelerated the
way the developers built features and the adoption of the platform by the
company.</p>
<p>The benefits:</p>
<ul>
<li>Code is fit for production during entire life cycle of the feature branch.</li>
<li>Makes performance testing easier (after all: it&rsquo;s deployed on the production environment).</li>
<li>Easier to share things with the stakeholders and thus improves collaboration.</li>
<li>You can deploy an entire set of microservices.</li>
</ul>
<p>The tools used for their implementation:</p>
<ul>
<li>GitHub (VCS)</li>
<li>Docker (code as configuration)</li>
<li>CodeFresh (CI)</li>
<li>Helm (CD)</li>
<li>Kubernetes (production platform)</li>
</ul>
<p>You can swap the aforementioned tools with other tools, but you must be able to
automate them and make sure that they work with the push of a single button.</p>
<p>GitHub repository for the demo:
<a href="https://github.com/yaron-idan/staging-environments-example">https://github.com/yaron-idan/staging-environments-example</a></p>
<h2 id="devops-to-the-next-level-with-serverless-chatops--jan-de-vries">DevOps to the Next Level with Serverless ChatOps &mdash; Jan de Vries</h2>
<p>What DevOps is about:</p>
<ul>
<li>Shipping code</li>
<li>Adding value</li>
<li>Do this continuously</li>
</ul>
<p>It&rsquo;s <strong>not</strong> about:</p>
<ul>
<li>Adding additional load to your team</li>
<li>Lowering quality</li>
<li>More support calls</li>
<li>Slow response times when there are errors</li>
</ul>
<p>One option is to send emails if something is wrong. But these emails are slow
(knowing that there was an issue <em>yesterday</em> is too late) and it generates a lot
of noise. Monitoring dashboards are nice, but you have to actively look at them
to detect if there&rsquo;s something wrong.</p>
<p>A better solution is using chat applications (like Microsoft Teams or Slack).</p>
<p>Your first step is to emit events when something fails (in Azure you can sent
such events to <a href="https://azure.microsoft.com/en-us/services/event-grid/">Event Grid</a>).
Next, you have to subscribe to these events/topics. You can use an Azure
Function for this and then have it post an actionable message to Teams.</p>
<p>These messages can have buttons to take immediate action (e.g. post to a web API
like an Azure Function) to recover from the problem. The output from the recover
action can also send events, so you can get another notification in your chat
application about the result.</p>
<p>GitHub repository with demo code: <a href="https://github.com/Jandev/ServerlessDevOps">https://github.com/Jandev/ServerlessDevOps</a></p>
<h2 id="building-modular-infrastructure-in-code--fergal-dearle">Building Modular Infrastructure in Code &mdash; Fergal Dearle</h2>
<p>Why use infrastructure as code (IaC)?</p>
<ul>
<li>Fergal is a fan of immutable infrastructure and the pets vs cattle analogy (which
goes further than just servers)</li>
<li>Everything as code</li>
<li>You don&rsquo;t have to log into a server via SSH to fix things</li>
<li>Better testability and maintainability</li>
</ul>
<p>The <a href="https://itrevolution.com/book/the-devops-handbook/">DevOps handbook</a> (part
III, chapter 9) talks about on demand spinning up a production-like environment.
The only way to do this is to use IaC.</p>
<p>First thing is understanding your infrastructure (VPC, networking, DNS,
services, database). Look at patterns like requestor/broker. Use these patterns
to create modular stacks.</p>
<p>Patterns:</p>
<ul>
<li>Singleton stack pattern: one stack per instance. But this is actually an
anti-pattern because you are mixing configuration and infrastructure.</li>
<li>Multiheaded stack pattern: multiple stacks in single project, config built in.</li>
<li>Template stack pattern: single stack, config separate, multiple instances from
that template</li>
</ul>
<p>Stack templates &amp; stack instances:</p>
<ul>
<li>Reusable template that implements building blocks</li>
<li>Appropriate tags</li>
<li>Must be able to uniquely identify instances (namespacing)</li>
</ul>
<blockquote>
<p>Stay clear of monoliths</p></blockquote>
<p>Monoliths are stacks with everything in them. This is one end of the spectrum.
The other end is to have one service per stack. You&rsquo;ll probably will want to end
up somewhere in between, where you have a component stack (e.g. with a
requestor/broker combination). And then you can combine those stacks.</p>
<p>Static stack inputs: environment names, app names. You should externalize this
config from your stack, e.g. by feeding these parameters via the command line or
use the <a href="https://docs.aws.amazon.com/systems-manager/latest/userguide/systems-manager-parameter-store.html">SSM Param Store</a>
and <a href="https://docs.aws.amazon.com/secretsmanager/latest/userguide/intro.html">Secrets Manager</a>.</p>
<p>(Note to self: Fergal mentioned <a href="https://github.com/Sceptre/sceptre">Sceptre</a>.
Check what this is about.)</p>
<p>Common problems:</p>
<ul>
<li>Drift can happen, especially if you also make manual changes (don&rsquo;t!)</li>
<li>Updates are not forward compatible</li>
<li>Region incompatibilities</li>
</ul>
<p>Best practices:</p>
<ul>
<li>Only use template stacks</li>
<li>Use layered and component</li>
<li>Externalize config</li>
<li>Test, test, test!</li>
<li>Only use automation, no manual steps</li>
</ul>
<h2 id="crossing-the-river-by-feeling-the-stones--simon-wardley">Crossing The River By Feeling The Stones &mdash; Simon Wardley</h2>
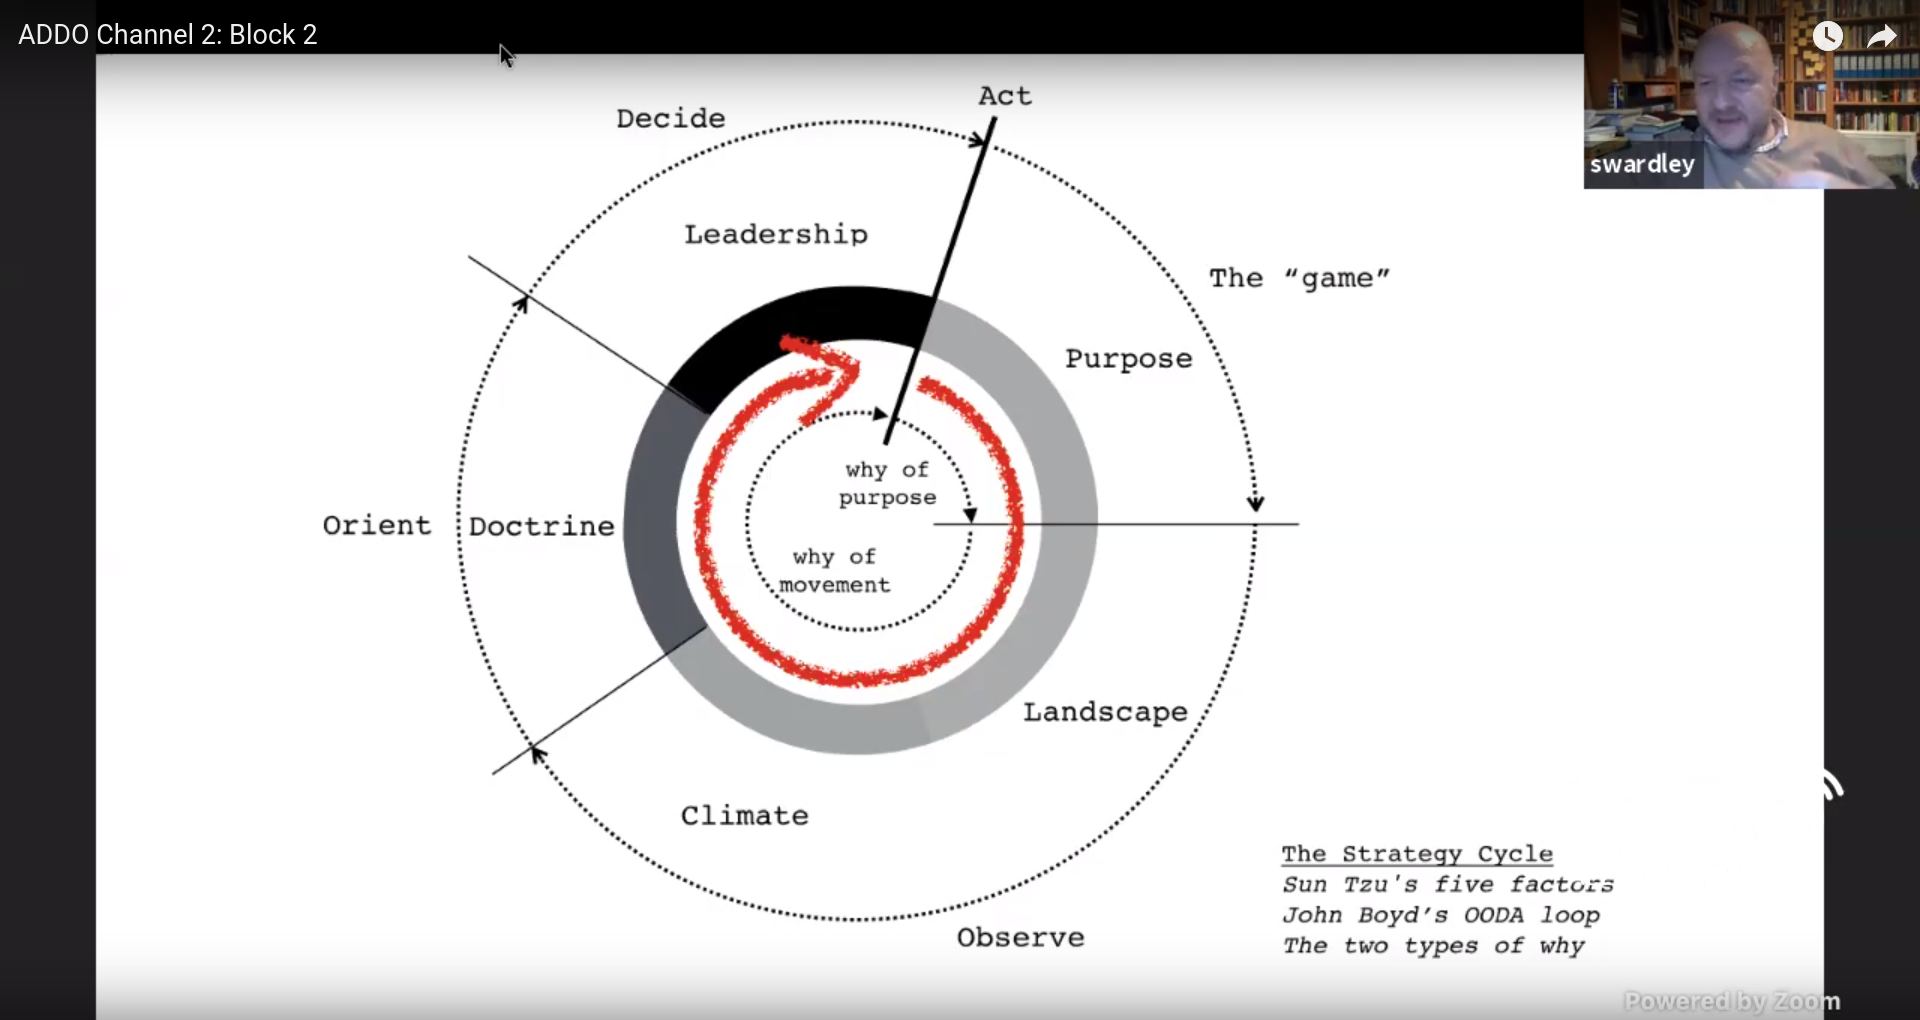
<p>In <a href="https://en.wikipedia.org/wiki/The_Art_of_War">The Art of War</a> Sun Tzu
discusses five fundamental factors which you should consider:</p>
<ul>
<li>Purpose</li>
<li>Landscape</li>
<li>Climate</li>
<li>Doctrine</li>
<li>Leadership</li>
</ul>
<p>John Boyd developed the <a href="https://en.wikipedia.org/wiki/OODA_loop">OODA loop</a>,
which cycles through the following:</p>
<ul>
<li>Observe</li>
<li>Orient</li>
<li>Decide</li>
<li>Act</li>
</ul>
<p>You can combine these cycles:</p>
<p><img src="/images/all_day_devops_2019_simon_wardley1.png" alt="Simon Wardley combining Sun Tzu&rsquo;s five factors and John Boyd&rsquo;s OODA loop"></p>
<p>By moving we learn, as long as we can observe the environment.</p>
<p>Maps are ways to:</p>
<ul>
<li>explore</li>
<li>communicate</li>
<li>share understanding</li>
<li>de-personalize</li>
</ul>
<p>Graphs are not maps. Identical graphs can spatially be different. On a map,
space has meaning, in a graph not. And because space has meaning, we can
explore, e.g. by asking ourselves the question &ldquo;what if we go in <em>that</em>
direction?&rdquo;</p>
<p>What makes a map?</p>
<ul>
<li>Anchor (compass)</li>
<li>Position (places, relative to the compass)</li>
<li>Consistency of movement (going to right below means go to south-east, assuming
on this map &ldquo;up&rdquo; is north)</li>
</ul>
<p>In business there are a lot of maps, e.g. a systems diagram. But almost
everything in business we call a map actually is a graph. Which means we don&rsquo;t
have a sense of the landscape.</p>
<p>How do you create a map for a business? Start with the anchors, e.g. business
and customers. Work from there to get all related components and express them in
a chain of needs.</p>
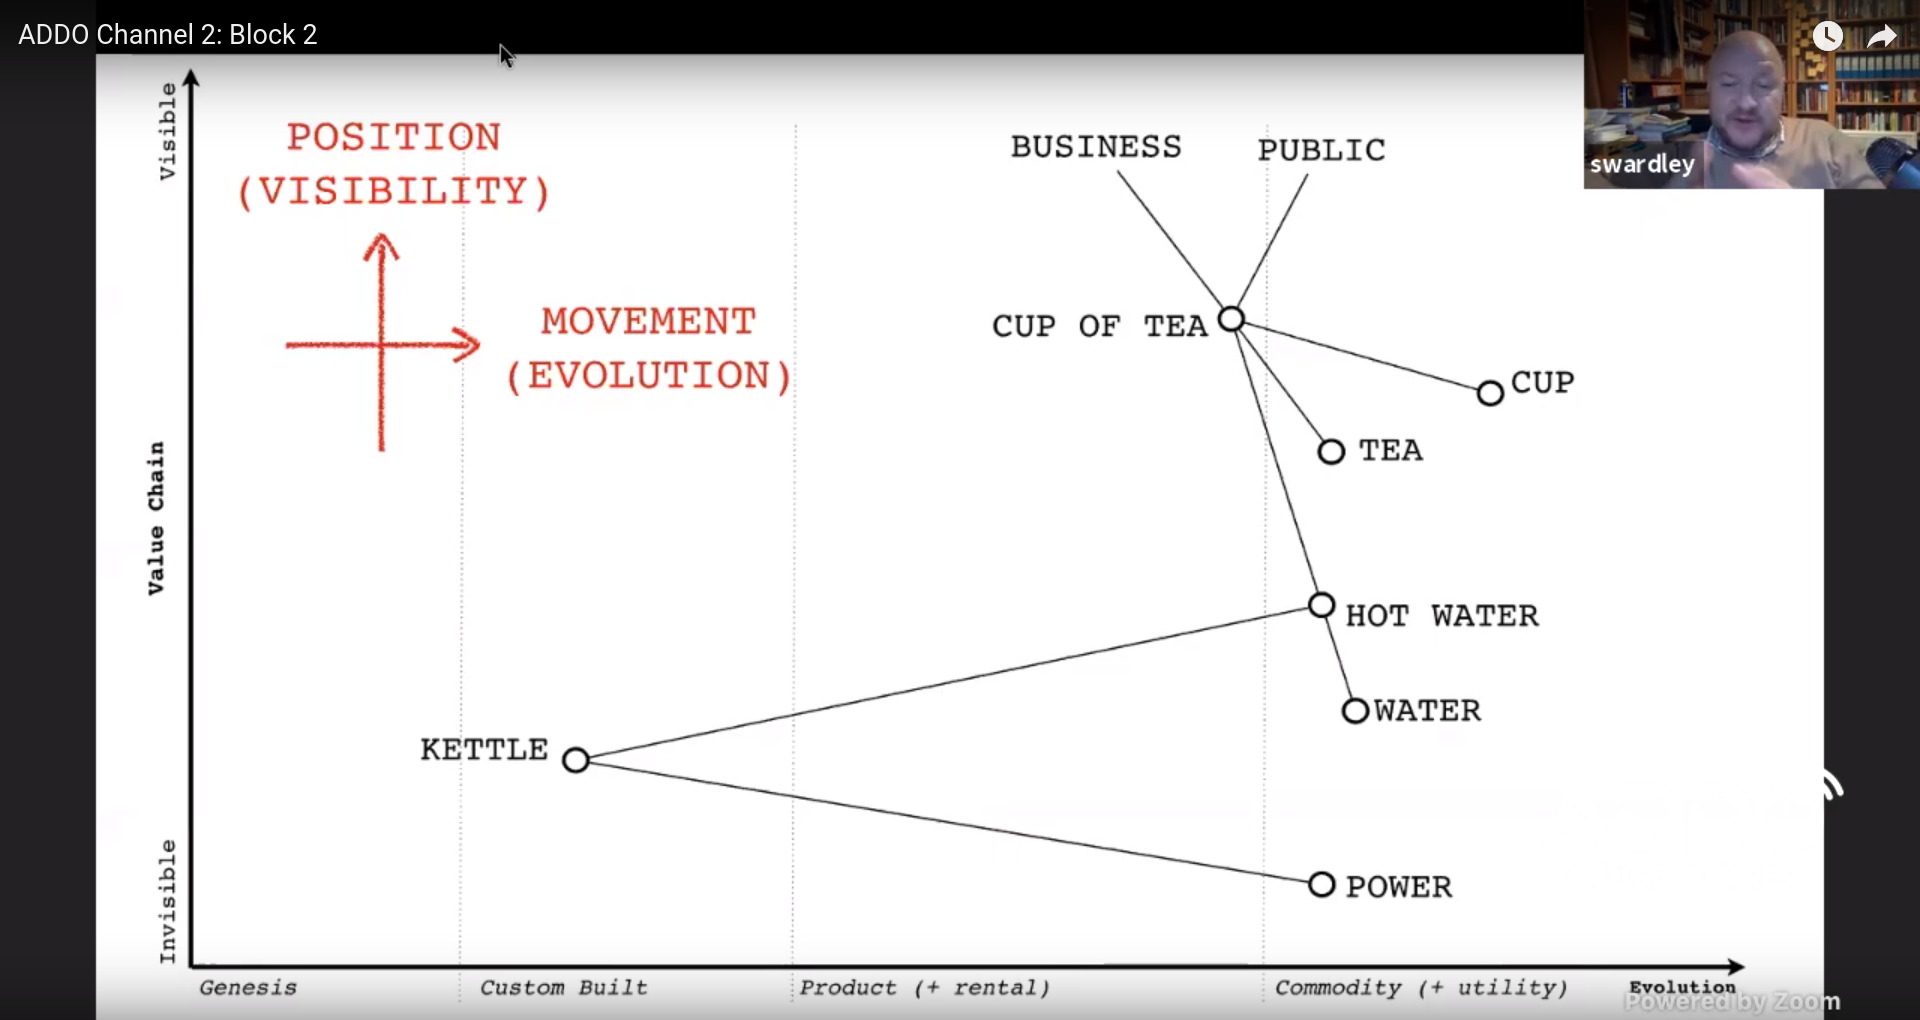
<p>But how do you position those components? We can use &ldquo;visibility&rdquo; as an analogy
of distance. You can use this to create a &ldquo;partial ordered chain of needs.&rdquo;</p>
<p>And what about movement? You can describe movement as a chain of changes. But
how do you do <em>that</em>? You can order components based on their evolutionary
stage. Are they in the genesis stage, do we use custom built components, do we
have standard products or can we consider it a commodity?</p>
<p>By combining these we can create a map of components by using the position
(visibility) on the y-axis and the movement (evolution) on the x-axis.</p>
<figure><img src="/images/all_day_devops_2019_simon_wardley2.png"
    alt="Simon Wardley showing a map"><figcaption>
      <p>Simon Wardley shows a map of a fictional company selling cups of tea</p>
    </figcaption>
</figure>

<p>You can add intent (evolutionary flow) to your map, e.g. move a component from
custom built to using a commodity.</p>
<p>By using such a map, you can de-personalize discussions since now you talk about
the map, not a story.</p>
<p>Simon told a story of a company that wanted to invest in robots to do manual
labour. After putting their business in a map, the problem became clear: they
were using custom built racks and as a result needed to customize their servers
because they would not fit their non-standard rack. Because the market had changed
since the company started, they could switch to commodity (cloud) and as a
result also did not need robots.</p>
<p>But keep this in mind:</p>
<blockquote>
<p>All maps are imperfect representations of a space</p></blockquote>
<h2 id="deploying-microservices-to-aws-fargate--ariane-gadd">Deploying Microservices to AWS Fargate &mdash; Ariane Gadd</h2>
<p>At KPMG they moved a project from using Amazon EC2 to AWS Fargate. They also
replaced CloudFormation with Terraform for standardization.</p>
<p>Why managed container services and not EKS?</p>
<ul>
<li>Immutable deployments</li>
<li>Cluster provisioning handled by Fargate</li>
<li>Only pay for what you execute</li>
<li>No OS patching</li>
<li>Smaller attack service</li>
</ul>
<p>They used <a href="https://github.com/fabfuel/ecs-deploy">ECS deploy</a> to deploy
containers to Fargate.</p>
<p>Why was the customer okay with this change?</p>
<ul>
<li>They were already familiar with Docker</li>
<li>Fargate has integrations with ECS and ECR.</li>
<li>Overhead of managing EC2 vs cost of AWS Fargate</li>
</ul>
<p>Fargate runs in your own VPC so you own the network, etc.</p>
<p>The microservices for this project are placed behind an application load
balancer (ALB) using AWS Web Application Firewall (WAF) and TLS termination.
Logs are sent to AWS CloudWatch Logs. They used Anchor for end-to-end container
security and compliance.</p>
<p>Benefits of AWS for KPMG:</p>
<ul>
<li>Cost reduction (automation tools were already in place, they already used
Lambda for account creation and had reserved instances)</li>
<li>Speed of delivery</li>
<li>Allows collaboration with developers (automation, DevOps).</li>
<li>70% of the engineers were already AWS certified.</li>
</ul>
<h2 id="automate-everyday-tasks-with-functions--sean-odell">Automate Everyday Tasks with Functions &mdash; Sean O&rsquo;Dell</h2>
<p>Common use cases for serverless applications are things like web applications
(such as static websites), data processing, Amazon Alexa (skills) and chatbots.</p>
<blockquote>
<p>Not every workload should run in a serverless fashion</p></blockquote>
<p>Organizational and application context are relevant. Serverless is just another
option. You pick what is right for your use case as serverless is not a silver
bullet.</p>
<p>AWS Lambda in a nutshell: there is an event source (e.g. a state change in data
or a resource), which triggers a function, which in turn interacts with a service.</p>
<p>GitHub repository with examples: <a href="https://github.com/vmwarecloudadvocacy/cloudhealth-lambda-functions">https://github.com/vmwarecloudadvocacy/cloudhealth-lambda-functions</a></p>
<p>(Note to self: check <a href="https://docs.amplify.aws/">Amplify</a>)</p>
<h2 id="beyond-dev--ops--patrick-debois">Beyond dev &amp; ops &mdash; Patrick Debois</h2>
<p>The DevOps pipeline usually starts at the backlog. But what happens before? And
how does that influence people outside the engineering department?</p>
<p>Patrick joined a startup five years ago. He fixed the DevOps pipeline. After a
while the organization wanted to sell a product.</p>
<p>The book <a href="https://www.amazon.com/Machine-Radical-Approach-Design-Function/dp/1626342245">The Machine</a>
by Justin Roff-March describes &ldquo;the agile version of sales.&rdquo;</p>
<p>Sales had more in common with IT than Patrick expected. The sales pipeline
looked like a Kanban board. Sales people are also on call, especially if you do
international sales. If we can deliver faster, this increases the chance of a
sale. Sales persons are actually mind readers; this reminded Patrick how IT
people feel about tickets in the backlog: &ldquo;what is meant with this ticket, what
do the customers actually want?&rdquo;</p>
<p>Thinking about the life of the project after it has been delivered, in terms of
maintenance and operational costs, is important. Doing this upfront, is
beneficial for the project.</p>
<p>The biggest impact sales had on IT was the never ending hammer of &ldquo;can you make
things simpler?&rdquo; Sales can help you with making your design less complex.
Together you can determine what actually adds value for the customer.</p>
<p>Having publicly available documentation really helps and makes it easier to sell
the product. Getting the customers on Slack also helped. This showed that the
company was willing to listen and help. This also helps sales.</p>
<p>After sales, the marketing department got focus. Patrick has seen the most
interesting automation within the marketing department (e.g. email sending).
Marketing has a lot of fancy metrics and tools to measure stuff; did they invent
metrics? The IT department can help marketing by providing information.
Conferences are also a marketing instrument. Marketing also has CALMS; they do
very similar things.</p>
<p>We&rsquo;ve got sales and marketing covered, but for a lot of things we still need
budgets. To budget things, you also need to estimate things. Finance knows what
it is to be on the receiving end of tickets where you have to guess what is
going on.</p>
<p>Sometimes you need to buy things. Patrick looked into agile procurement. Lots of
stuff has to be figured out: is it a fit? is there a way to be partners?</p>
<p>Serverless is a manifestation of servicefull, where you use a lot of services,
so you can focus on your domain instead of having to build everything yourself.</p>
<p>With cloud services there doesn&rsquo;t have to be communication initially: you read
the website, check the documentation, pull your credit card and start with a
proof of concept. Communication is still important. You have to treat your
suppliers with respect.</p>
<p>HR: how does your company support hiring people? Have people join the team for
some actual work to see if they are a good fit or not.</p>
<p>Do you know what <a href="https://en.wikipedia.org/wiki/Pair_programming">pair programming</a>
is? Well, <a href="https://en.wikipedia.org/wiki/Mob_programming">mob programming</a> is a whole
other level of collaborating. (Note that it&rsquo;s more than just have one person
typing and a bunch of other people commenting&mdash;it has a lot of patterns going
on.) Teams can get very enthusiastic about this and can be very productive the
first week. But if they are not careful, the team is exhausted the next week.
You need to develop a sustainable pace.</p>
<p>Patrick learned a lot from talking to the different departments. They are solving
similar problems as IT is.</p>
<p>Reading tip:
<a href="https://www.amazon.com/Company-wide-Agility-Beyond-Budgeting-Sociocracy/dp/154467287X">Company-wide Agility with Beyond Budgeting, Open Space &amp; Sociocracy</a>
by Jutta Eckstein and John Buck.</p>
<h2 id="the-open-source-observability-toolkit--mickey-boxell">The Open Source Observability Toolkit &mdash; Mickey Boxell</h2>
<p>Some characteristics of a modern application:</p>
<ul>
<li>Microservices</li>
<li>Distributed</li>
<li>Multiple programming languages</li>
<li>Scalable</li>
<li>Ephemeral</li>
</ul>
<p>This brings new challenges compared to the old situation with a monolithic
application running on a single machine. You still want to address threats to
customer satisfaction. But the old debugging solutions we used for a monolith
will not work.</p>
<p>Observability means designing and operating a more visible system. This includes
systems that can explain themselves without you having to deploy new code. The
tools help you understand the difference between a healthy and unhealthy system.</p>
<blockquote>
<p>Modern, distributed systems <strong>will</strong> experience failures.</p></blockquote>
<p>Observability takes a holistic approach that recognizes the impact an issue has
on the business as a whole. Outages affect the whole business, which should be
able to react. Observability gives tools to address issues when they arrive.</p>
<p>External outputs:</p>
<ul>
<li>Logs</li>
<li>Metrics</li>
<li>Traces</li>
</ul>
<p>These outputs don&rsquo;t make your system more observable, but they can be part of
the holistic approach. They can help you with e.g. a root cause analysis.</p>

  <figure>

<blockquote >
Monitoring tells you whether a system is working, observability lets you ask
why it isn&rsquo;t working.
</blockquote>

  <figcaption>
    &mdash;Baron Schwartz
  </figcaption>
  </figure>


<p>Key SRE concepts:</p>
<ul>
<li>Service Level Indictors (SLIs; what are you measuring), Service Level
Objectives (SLOs; what should the values be), Service Level Agreements (SLAs;
defines the planned reaction if the objectives are not met).</li>
<li>Subset of Google&rsquo;s golden SRE signals: RED (Rate, Errors, Duration).</li>
<li>Mean Time To Failure (MTTF) and Mean Time To Repair (MTTR)</li>
</ul>
<p>Users are comfortable with a certain level of imperfection. A site that is a bit
slow sometimes, is less annoying than a shopping cart that sometimes looses its
content. Use this to determine what you&rsquo;ll spend your time on first.</p>
<h3 id="logging">Logging</h3>
<p>Logging is the most fundamental pillar of monitoring. Logging records events
that took place at a given time. Supported by most libraries because it is such
a fundamental thing.</p>
<p>You only get logs if you actually put them in your code. You also have to make
sure you don&rsquo;t lose them, for instance by aggregating them.</p>
<p>Tools:</p>
<ul>
<li><a href="https://www.fluentd.org/">Fluentd</a>: scrape, process and ship logs</li>
<li><a href="https://www.elastic.co/elasticsearch/">Elasticsearch</a>: a data store</li>
<li><a href="https://www.elastic.co/kibana/">Kibana</a>: interact with your logs</li>
</ul>
<h3 id="metrics">Metrics</h3>
<p>Metrics are a numeric aggregation of data describing the behavior of a component
measured over time. They are useful to understand typical system behavior.</p>
<p>Tools:</p>
<ul>
<li><a href="https://prometheus.io/">Prometheus</a>: scrape data, store the data and query
the data</li>
<li><a href="https://grafana.com/">Grafana</a>: visualize the metrics, can aggregate data
from different sources</li>
</ul>
<p>Alerts are notifications to indicate that a human needs to take action.</p>
<h3 id="tracing">Tracing</h3>
<p>Tracing is capturing a set of causally related events. Helpful for debugging.
Example: each request has a global ID and if you insert this ID as metadata at
each step, you can trace what happens.</p>
<p>Tools: <a href="https://www.jaegertracing.io/">Jaeger</a> and <a href="https://zipkin.io/">Zipkin</a>
can visualize and inspect traces.</p>
<p>The challenge is that tracing is hard to retrofit into an existing application.
You need to instrument all component. Service meshes can make it easier to
retrofit tracing.</p>
<h3 id="service-meshes">Service meshes</h3>
<p>A service mesh is a configurable infrastructure layer for microservice
applications. It can monitor and control the traffic in your environment. It can
be a great approach for observability. You will get less information from a
service mesh compared to adding tracing to all of your components, but on the
other hand it takes less effort to implement than instrumenting your existing
code base.</p>
<p>Tools:</p>
<ul>
<li><a href="https://istio.io/">Istio</a></li>
<li><a href="https://linkerd.io/">Linkerd</a></li>
<li><a href="https://traefik.io/traefik-mesh/">Maesh</a><sup id="fnref:1"><a href="#fn:1" class="footnote-ref" role="doc-noteref">1</a></sup></li>
<li><a href="https://kuma.io/">Kuma</a></li>
<li><a href="https://www.consul.io/">Consul</a></li>
</ul>
<p>Using service meshes won&rsquo;t eliminate the need to instrument your code, but it
can make your life more simple.</p>
<div class="footnotes" role="doc-endnotes">
<hr>
<ol>
<li id="fn:1">
<p>Called Traefik Mesh these days.&#160;<a href="#fnref:1" class="footnote-backref" role="doc-backlink">&#x21a9;&#xfe0e;</a></p>
</li>
</ol>
</div>]]></content>
  </entry>
  <entry>
    <title type="html"><![CDATA[Microsoft Ignite | The Tour: Amsterdam — day two]]></title>
    <link rel="alternate" href="https://markvanlent.dev/2019/03/21/microsoft-ignite-the-tour-amsterdam-day-two/" type="text/html" />
    <id>https://markvanlent.dev/2019/03/21/microsoft-ignite-the-tour-amsterdam-day-two/</id>
    <author>
      <name>map[name:Mark van Lent uri:https://markvanlent.dev/about/]</name>
    </author>
    <category term="azure" />
    <category term="cloud" />
    <category term="devops" />
    <category term="infrastructure as code" />
    <category term="monitoring" />
    <category term="observability" />
    <category term="sre" />
    
    <updated>2021-11-09T20:09:33Z</updated>
    <published>2019-03-21T00:00:00Z</published>
    <content type="html"><![CDATA[<p>On the second day of <em>Microsoft Ignite | The Tour: Amsterdam</em> I attended talks in
the &ldquo;Operating applications and infrastructure in the cloud&rdquo; learning path.</p>
<p>(On the <a href="/2019/03/20/microsoft-ignite-the-tour-amsterdam-day-one/">first day</a>
I followed the sessions of the &ldquo;Building your application for the cloud&rdquo;
learning path.)</p>
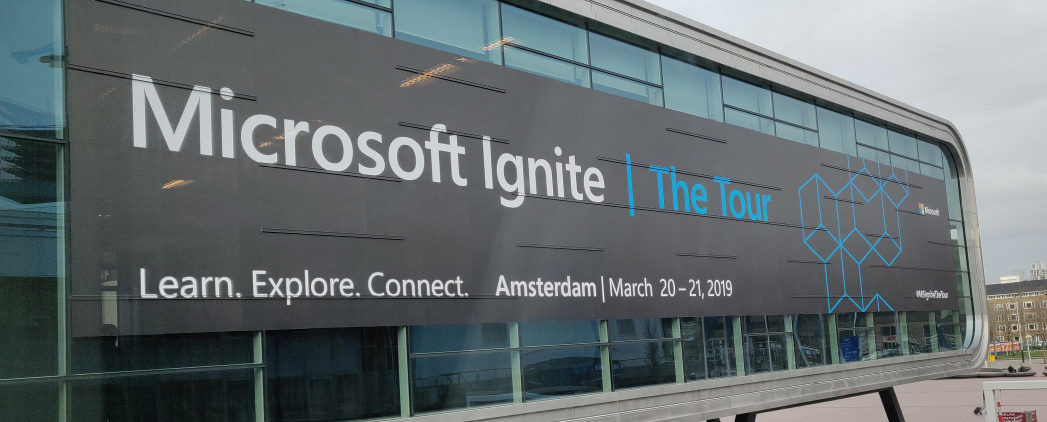
<p><img src="/images/mitta2019_banner.jpg" alt="Microsoft Ignite | The Tour: Amsterdam banner at the RAI Amsterdam"></p>
<h2 id="modernizing-your-infrastructure-moving-to-infrastructure-as-code-iac--emily-freeman">Modernizing your infrastructure: moving to Infrastructure as Code (IaC) &mdash; Emily Freeman</h2>
<p>Operations is changing&mdash;modernizing. DevOps reduces or eliminates the friction
between the development and operations teams.</p>
<p>One way of defining DevOps is with the CALMS acronym:</p>
<ul>
<li>Culture</li>
<li>Automation</li>
<li>Lean</li>
<li>Measurement</li>
<li>Sharing</li>
</ul>
<p>SRE has evolved beyond its original form. SRE can be seen as a prescriptive
implementation of DevOps. It has a focus on deploying and maintaining
applications.</p>
<p>About failure:</p>
<blockquote>
<p>In the cloud, sometimes it is rainy.</p></blockquote>
<p>If you are using the cloud, you are using APIs continuously. This allows us to
automate a lot of things. And do configuration via (YAML) files which can be
version controlled. This gives us repeatability and reliability.</p>
<p>Toil is defined as manual, repetitive work. Automation removes the toil. By
creating code to do the work, we can reuse it.</p>
<p><a href="https://docs.microsoft.com/en-us/azure/azure-resource-manager/templates/">Azure Resource Manager templates</a>:
you can manually deploy infrastructure and then view the template from within
the Azure portal. This template is a configuration file which you can store and
use over and over again.</p>
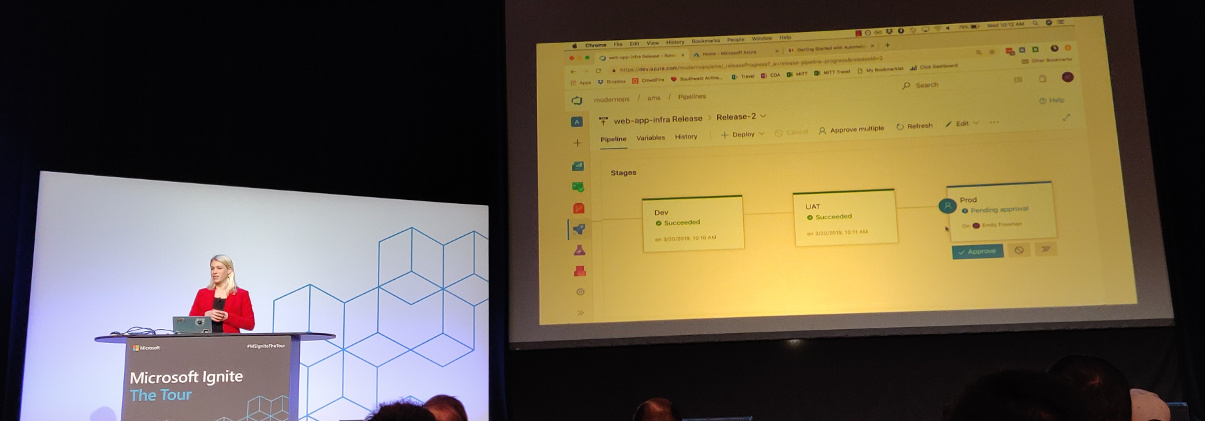
<p>Deploying small batches of code is key. The risk of small changes is less than
having big (and many) changes. Small batches also make it simpler to identify
bugs. Releasing often makes sure feedback on changes is received faster.</p>
<p><img src="/images/mitta2019_emily_freeman_1.jpg" alt="Emily Freeman demonstrating Azure Pipeline"></p>
<p>Microsoft works hard to make sure that
<a href="https://azure.microsoft.com/en-us/services/devops/pipelines/">Azure Pipelines</a> work
with the tools you already use.</p>
<p>Additional resources:</p>
<ul>
<li><a href="https://github.com/Microsoft/IgniteTheTour/tree/master/SRE%20-%20Operating%20applications%20and%20infrastructure%20in%20the%20cloud/SRE10">Code</a></li>
<li><a href="https://queue.acm.org/detail.cfm?id=2945077">The Small Batches Principle</a></li>
</ul>
<h2 id="monitoring-your-infrastructure-and-applications-in-production--jason-hand">Monitoring your infrastructure and applications in production &mdash; Jason Hand</h2>
<p>Why, what and how do we monitor?</p>
<p>Let&rsquo;s first have a look at a definition of SRE:</p>
<blockquote>
<p>Site Reliability Engineering is an engineering discipline devoted to helping
an organization sustainably achieve the <strong>appropriate</strong> level of
<strong>reliability</strong> in their systems, services, and products.</p></blockquote>
<p>Note the terms &ldquo;appropriate&rdquo; and &ldquo;reliability.&rdquo; Hundred percent reliability is
expensive but not always needed. For planes and pacemakers you want absolute
reliability. For applications, this usually is not needed. Ask yourself what the
parts of reliability are that you want to be concerned with.</p>
<p>Why monitor?</p>
<ul>
<li>Are apps doing what we expect from them?</li>
<li>Are apps doing what <em>others</em> (customers) expect?</li>
<li>Are we meeting our goals or at least moving in the right direction?</li>
<li>Our systems are constantly in change. What is happening with these changes?</li>
</ul>
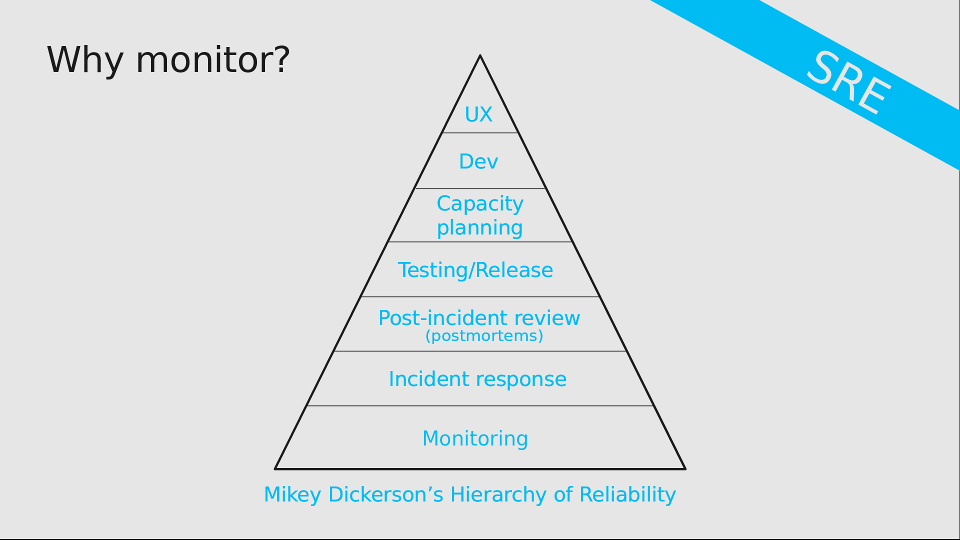
<p>Monitoring is the most important part of reliability.</p>
<figure><img src="/images/mitta2019_why_monitor_sheet.png"
    alt="Mikey Dickerson’s Hierarchy of Reliability"><figcaption>
      <p>Source: sheets from this presentation</p>
    </figcaption>
</figure>

<p>The difference between <em>reacting</em> and <em>responding</em> to incidents is being
prepared or not. You&rsquo;ll want to be prepared to be able to respond, not just
react.</p>
<p>Some organizations perform <a href="https://en.wikipedia.org/wiki/Root_cause_analysis">root cause analyses</a>
after failures. Complex systems usually don&rsquo;t have a single root cause though&mdash;more
often than not it is a combination of causes. Since having more than one root
cause is a contradiction in terms, Jason much rather talks about &ldquo;post-incident
reviews.&rdquo;</p>
<p>Back to the term <em>reliability</em>. This can be measured in a lot of ways. To name a
few:</p>
<ul>
<li>Availability: will the system respond when I ask it something?</li>
<li>Latency: &ldquo;slow is the new down&rdquo; (we don&rsquo;t have the time for slow applications).</li>
<li>Throughput: can you get the volume of data from one point to another in a way you expect?</li>
<li>Coverage: can a process plough through all the available data?</li>
<li>Correctness: did it do what it was supposed to do?</li>
<li>Fidelity: See for example Netflix: perhaps the search is temporarily
unavailable but you can still scroll through the catalog and watch a movie.</li>
<li>Freshness: is the data you get the most recent stuff?</li>
<li>Durability: if you write data, can you retrieve it again?</li>
</ul>
<p>It is not just about what <em>we</em> see, but also about what <em>our customer</em> experiences. We
should put the customer first and look at things from their perspective.</p>
<p>Service Level Indicators (SLIs) are a ratio/proportion. For instance: the
number of successful HTTP calls divided by the total number of HTTP calls.</p>
<p>But where do the numbers come from? A few options:</p>
<ul>
<li>Reported by the server</li>
<li>Reported by clients</li>
<li>Reported by the application</li>
<li>Reported by the front-end (load balancer)</li>
<li>Reported by our monitoring / testing infrastructure</li>
</ul>
<p>You need to include the way you measure in the SLI.</p>
<p>There is no &ldquo;right way&rdquo; to measure things, but there are trade-offs. And you
need to be aware of them. Ideally you should monitor as close to the user as
possible.</p>
<p>The SLIs are the measurements. The Service Level Objectives (SLOs) determine
what is acceptable. If the SLI (indicator) dips below the SLO (objective), we
need to get people involved.</p>
<p>How to build a good SLO? Take the thing to monitor (e.g. HTTP requests), look at
the SLI proportions and add a time statement. An example: &ldquo;90% of the HTTP
requests as reported by the load balancer succeeded in the last 30 day window.&rdquo;
You can make your SLOs more complex if needed, e.g. by having a lower and upper
bound.</p>
<p>Alert on actionable things. Alerts are <strong>not</strong> logs, notifications, heartbeats
or normal situations. Alerts are about things a person needs to go do. And not
just any person, but the right person. It should not be something that can
be automated. Ideally alerts are pretty simple and include:</p>
<ul>
<li>Where is this coming from?</li>
<li>Which SLO is breached?</li>
<li>What is the impact for the customer?</li>
<li>What systems are impacted?</li>
<li>What are the first couple of steps to take?</li>
</ul>
<p>Possible future direction of monitoring:</p>
<ul>
<li>There&rsquo;s no one silver bullet. We&rsquo;ll probably want to integrate multiple monitoring solutions.</li>
<li>Modular monitoring</li>
<li>Aggregate monitoring (measure the system as a whole)</li>
<li>Correlation and anomaly detection (AI / ML)</li>
<li>Monitoring the monitoring</li>
</ul>
<p>Additional resources:</p>
<ul>
<li><a href="https://github.com/Microsoft/IgniteTheTour/tree/master/SRE%20-%20Operating%20applications%20and%20infrastructure%20in%20the%20cloud/SRE20">Code</a></li>
<li><a href="https://docs.microsoft.com/en-us/azure/azure-monitor/overview">Azure Monitor overview</a></li>
</ul>
<h2 id="troubleshooting-failure-in-the-cloud--jason-hand">Troubleshooting failure in the cloud &mdash; Jason Hand</h2>
<p>Our systems have become more complex than they have been in the past. We are now
using microservices, containers, functions, etc. Our focus for this session:
going from the detection phase (previous session) to the response phase.</p>
<p>Before talking about how to detect something is wrong, you need to define that
you mean with &ldquo;wrong.&rdquo;</p>
<p>Azure has a nice toolbox to help you:</p>
<ul>
<li><a href="https://azure.microsoft.com/en-us/services/monitor/">Azure monitor</a></li>
<li><a href="https://docs.microsoft.com/en-us/azure/service-health/service-notifications">Service health alerts</a></li>
<li><a href="https://docs.microsoft.com/en-us/azure/azure-monitor/app/app-insights-overview">Azure Application Insights</a></li>
<li><a href="https://docs.microsoft.com/en-us/azure/azure-monitor/essentials/platform-logs-overview">Diagnostic logs</a> (application and system)</li>
<li>Live debugging via log streams</li>
<li><a href="https://docs.microsoft.com/en-us/azure/azure-monitor/logs/log-query-overview">Log Analytics</a></li>
</ul>
<p>The first question is often: is it just me? Azure (and the other cloud
providers) can also have problems. The
<a href="https://docs.microsoft.com/en-us/azure/service-health/resource-health-overview">Azure Resource Health</a>
page in the Service Health section shows you if your components have problems.
It even has historical data. But because you don&rsquo;t want to stare at a dashboard
all day long, you&rsquo;ll want to also have health alerts for when something goes
wrong.</p>
<p>Guidance for creating service health alerts:</p>
<ul>
<li>Don&rsquo;t create too many, but also not too few. Find your sweet spot.</li>
<li>Make sure they don&rsquo;t overlap (to avoid confusion).</li>
<li>Don&rsquo;t alert on non-production environments.</li>
<li>Keep the responders in mind (what would they want).</li>
<li>Separate alerts for issues, planned maintenance and advisories.</li>
</ul>
<p><a href="https://docs.microsoft.com/en-us/azure/azure-monitor/app/app-map">Application Map</a> shows
components and how they interact with each other. Where is slowness? Where are
problems?</p>
<p>You will need to
<a href="https://docs.microsoft.com/en-us/azure/app-service/troubleshoot-diagnostic-logs">enable diagnostic logging</a>
to get a bunch of logs. And you don&rsquo;t have to go to the portal, you can use the
CLI tool to download them. You can then use a separate tool to analyse the logs.</p>
<div class="highlight"><pre tabindex="0" class="chroma"><code class="language-bash" data-lang="bash"><span class="line"><span class="cl">az webapp log download --resource-group &lt;name&gt; --name &lt;webapp name&gt;
</span></span></code></pre></div><p><a href="https://azure.microsoft.com/en-us/features/cloud-shell/">Azure Cloud Shell</a>
allows you to have a terminal session in your browser. You don&rsquo;t need your
local CLI.</p>
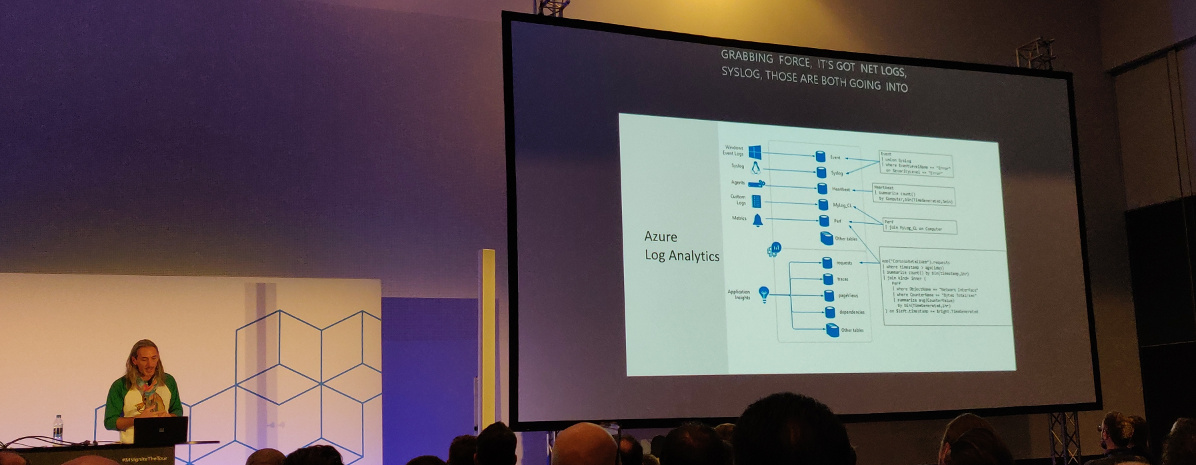
<p>Use Log Analytics for more complex troubleshooting. It collects a lot of
information from a log of sources.</p>
<p><img src="/images/mitta2019_jason_hand_3.jpg" alt="Jason Hand about Azure Log Analytics"></p>
<p>You&rsquo;ll need to use the <a href="https://docs.microsoft.com/en-us/azure/data-explorer/kusto/query/">Kusto Query Language</a>
to get to the information. Queries start with a table, then commands to filter,
sort, specify time range, etc. Once you have queries that answer your questions,
you can keep them handy by saving them right in the Azure portal.</p>
<p>Azure <a href="https://docs.microsoft.com/en-us/azure/azure-monitor/visualize/workbooks-overview">Monitor Workbooks</a>
and Troubleshooting Guides (a.k.a. runbooks) combine text, queries, metrics and
parameters into reports. This helps with onboarding and will also help your
first responders.</p>
<p>Workbooks are editable by others that have access to the same resources.
Troubleshooting Guides are like workbooks, but for dealing with problems.</p>
<p>Future for troubleshooting:</p>
<ul>
<li>Observability (<a href="https://opencensus.io/">OpenCensus</a> and other distributed
tracing tools)</li>
<li>Anomaly detection</li>
</ul>
<p>Additional resources:</p>
<ul>
<li><a href="https://github.com/Microsoft/IgniteTheTour/tree/master/SRE%20-%20Operating%20applications%20and%20infrastructure%20in%20the%20cloud/SRE30">Code</a></li>
<li><a href="https://docs.microsoft.com/en-us/azure/azure-monitor/logs/get-started-queries">Get started with Azure Monitor log queries</a></li>
</ul>
<h2 id="scaling-for-growth-and-resiliency--jeramiah-dooley">Scaling for growth and resiliency &mdash; Jeramiah Dooley</h2>
<p>How do we take an application and how do we scale it? Bigger picture: asking a
lot of &ldquo;why?&rdquo; questions.</p>
<p>Do we need to scale out our application and the underlying infrastructure? Maybe.</p>
<ul>
<li>Perhaps we should first check if the application is buggy (memory leaks) or if
we can optimize it for performance (e.g. database queries).</li>
<li>Is there a temporary (or artificial) reason the site has a spike?</li>
<li>Is there unused capacity we can move around?</li>
<li>Scaling costs money, but if we don&rsquo;t do it we give the customers a bad
experience. This is a risk vs expense issue.</li>
<li>When is the application no longer meeting our expectations (SLOs)?</li>
</ul>
<p>We need to factor for both the anticipated and unanticipated spikes.</p>
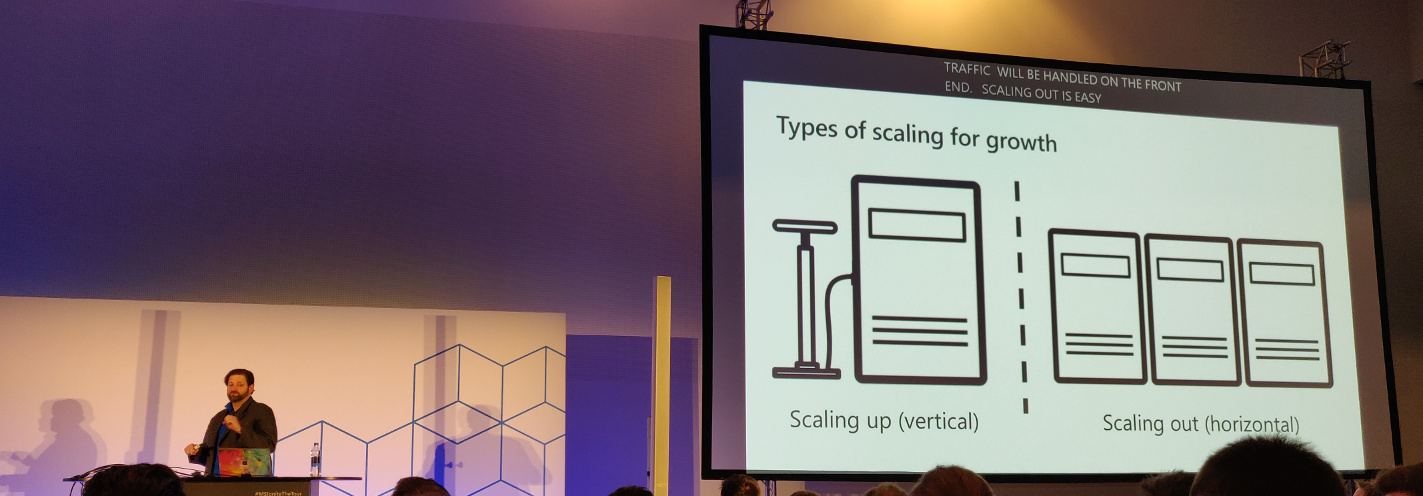
<p>One can scale up (vertical) or out (horizontal). Scaling up is adding more
resources (CPU, memory) to an instance. Scaling out is adding more machines.
When scaling out, the application needs to be aware of the change (additional or
less instances).</p>
<p><img src="/images/mitta2019_jeramiah_dooley_2a.jpg" alt="Jeramiah Dooley about scaling up vs scaling out"></p>
<p>You might not want to scale just one portion of an app since it can cause
problems in another part of the app.</p>
<p>Autoscaling can trigger on quite specific conditions: only today if CPU &gt; 80%
add more instances.</p>
<p>But should you use autoscaling?</p>
<ul>
<li>Do you know your app? When do you need to add more resources? How will your
app respond? How quickly? What happens when you scale down?</li>
<li>Do you know your traffic?</li>
<li>Autoscaling also has its limits. (E.g. there is going to be a delay.)</li>
<li>Do you understand the metrics that matter?</li>
</ul>
<blockquote>
<p>It&rsquo;s not magic, it&rsquo;s just automation.</p></blockquote>
<p>An autoscaling profile has:</p>
<ul>
<li>Capacity:
<ul>
<li>Minimum</li>
<li>Maximum</li>
<li>Default</li>
</ul>
</li>
<li>Triggers (a metric we want to trigger on and a value for that metric)</li>
<li>Recurrence (when do we want this to happen? Always? First week of the month?)</li>
</ul>
<p>Warnings with regards to autoscaling:</p>
<ul>
<li>Scaling out will happen when <em>any</em> of the triggers are met.</li>
<li>Scaling in will trigger when <em>all</em> triggers are met.</li>
<li>Autoscaling always wins over manual scaling settings.</li>
</ul>
<p>Okay, we know how to handle load. But do we know what to do when we have a
localized failure (e.g. a data center that goes down)? Use:</p>
<ul>
<li>Multiple regions/geographies</li>
<li>Region pairs</li>
<li>Availability zones</li>
</ul>
<figure><img src="/images/mitta2019_jeramiah_dooley_2b.jpg"
    alt="Jeramiah Dooley about the relation between Geography, Region Pairs, Regions and Availability Zones"><figcaption>
      <p>Jeramiah Dooley about the relation between Geography, Region Pairs, Regions and Availability Zones</p>
    </figcaption>
</figure>

<p><a href="https://azure.microsoft.com/en-us/services/frontdoor/">Azure Front Door</a>:</p>
<ul>
<li>Global HTTP load balancer with instance failover</li>
<li>Bonuses:
<ul>
<li>SSL offloading</li>
<li>Firewall and DDoS Protections</li>
<li>Central control plane for traffic orchestration</li>
</ul>
</li>
</ul>
<p>Future possible directions for scaling:</p>
<ul>
<li>Content delivery networks (CDNs)</li>
<li>Failovers</li>
<li>Traffic shaping</li>
<li>Draining data centers</li>
</ul>
<p>Additional resources:</p>
<ul>
<li><a href="https://github.com/Microsoft/IgniteTheTour/tree/master/SRE%20-%20Operating%20applications%20and%20infrastructure%20in%20the%20cloud/SRE40">Code</a>
(Tip: the code apparently has a very nice deployment script.)</li>
<li><a href="https://docs.microsoft.com/en-us/azure/app-service/manage-scale-up">Scale up an app in Azure</a></li>
<li><a href="https://docs.microsoft.com/en-us/azure/azure-monitor/autoscale/autoscale-get-started">Get started with Autoscale in Azure</a></li>
<li><a href="https://docs.microsoft.com/en-us/azure/best-practices-availability-paired-regions">Business continuity and disaster recovery (BCDR): Azure Paired Regions</a></li>
<li><a href="https://docs.microsoft.com/en-us/azure/frontdoor/front-door-overview">What is Azure Front Door Service?</a></li>
</ul>
<h2 id="responding-to-and-learning-from-failure--emily-freeman">Responding to and learning from failure &mdash; Emily Freeman</h2>
<p>Failure is inevitable.</p>
<p>Teach people how to solve problems. It will prevent you from being woken up for
everything at night.</p>
<p><img src="/images/mitta2019_emily_freeman_2.jpg" alt="Emily Freeman"></p>
<p>Having to react to failure leads to:</p>
<ul>
<li>Unplanned work</li>
<li>Context switching</li>
<li>Confusion</li>
<li>Increased time to repair</li>
</ul>
<p>We tolerate a certain level of failure every day. Things that are <strong>not</strong> fine
however:</p>
<ul>
<li>Alerts to inbox</li>
<li>Alerts to a common channel where memes are combined with alerts since you&rsquo;ll miss
the important stuff</li>
<li>Shoulder tapping</li>
<li>Delays in communication</li>
<li>Tiered and off-shore support</li>
<li>Network Operations Center</li>
</ul>
<p>We can borrow concepts from other disciplines. Like creating a space to
communicate and collaborate. Ideally there is a single space for all
communication for an incident; a space devoted to that single incident. The
benefits of having such a space: you&rsquo;ll have a time stamped record (which helps
the post-incident review), and it focusses communication.</p>
<p>Train your first responders and provide them with context and clear escalation
procedures.</p>
<p>Update your stakeholders throughout the incident.</p>
<p>Important when alerting is adding a severity of the incident:</p>
<ul>
<li>Sev1 (critical): complete outage</li>
<li>Sev2 (critical): major functionality broken, revenue affected</li>
<li>Sev3 (warning): minor problem</li>
<li>Sev4 (warning): redundant component failure</li>
<li>Sev5 (info): false alarm or unactionable alert</li>
</ul>
<p>The life cycle of an incident:</p>
<ul>
<li>Detection: discovering that there is an issue. You&rsquo;ll have to figure out what
is wrong ASAP.</li>
<li>Response: about 1/3 of your time is spent in this phase. The incident
commander (IC) is the person in charge of the incident response. A
communication chief (or scribe, or whatever you call this person) documents
the situation for a historical record. Don&rsquo;t use this to place blame, but to
analyze what happened.</li>
<li>Remediation: you know what went wrong and how to fix it. Always under-promise
and over-deliver in your timeline. ChatOps tools might help to remediate a
situation.</li>
<li>Analysis: host a post-incident review to learn from what happened. The goal is
not to produce artifacts, instead the goal is to maximize organizational
learning. Prevent a similar incident in the future. Record counter measures
and assign a date and responsible person.</li>
<li>Readiness: prepare for the future.</li>
</ul>
<blockquote>
<p>Incidents are not linear and neither is the response.</p></blockquote>
<p>The last two phases are often forgotten while they are the most important. Since
these will prevent the same failure in the future from happening.</p>
<p>Additional resources:</p>
<ul>
<li><a href="https://github.com/Microsoft/IgniteTheTour/tree/master/SRE%20-%20Operating%20applications%20and%20infrastructure%20in%20the%20cloud/SRE50">Code</a></li>
<li><a href="https://risk-engineering.org/concept/Rasmussen-practical-drift">Rasmussen and practical drift</a></li>
<li><a href="https://docs.microsoft.com/en-us/azure/logic-apps/">Azure Logic Apps Documentation</a> (concerning building automated workflows)</li>
<li><a href="https://docs.microsoft.com/en-us/azure/azure-monitor/alerts/alerts-overview">Overview of alerts in Microsoft Azure</a></li>
<li><a href="https://docs.microsoft.com/en-us/learn/modules/build-chat-bot-with-azure-bot-service/">Build a chat bot with the Azure Bot Service</a></li>
</ul>]]></content>
  </entry>
  <entry>
    <title type="html"><![CDATA[Open tabs — March 2019]]></title>
    <link rel="alternate" href="https://markvanlent.dev/2019/03/14/open-tabs-march-2019/" type="text/html" />
    <id>https://markvanlent.dev/2019/03/14/open-tabs-march-2019/</id>
    <author>
      <name>map[name:Mark van Lent uri:https://markvanlent.dev/about/]</name>
    </author>
    <category term="aws" />
    <category term="blog" />
    <category term="devops" />
    <category term="go" />
    <category term="observability" />
    <category term="monitoring" />
    <category term="sre" />
    <category term="tabs" />
    
    <updated>2021-11-09T20:09:33Z</updated>
    <published>2019-03-14T00:00:00Z</published>
    <content type="html"><![CDATA[<p>Last May I <a href="/2018/05/12/open-tabs/">published the list of tabs</a> I had
open on my phone at that moment in time. This another one of those posts.</p>
<p>I have switched phones but there were about 50 tabs open in the browser on my
old phone. This article is a selection of the pages I want to (re)read in the
future.</p>
<h2 id="go">Go</h2>
<p>I want to learn <a href="https://golang.org/">Go</a>. This is a list of resources that seem
useful:</p>
<dl>
<dt><a href="https://elsesiy.com/blog/containerization-of-golang-applications">Containerization of Golang applications</a></dt>
<dd>An example by Jonas-Taha El Sesiy (including a <code>Dockerfile</code> and <code>Makefile</code>) of how
you can deploy a Go application in a Docker image.</dd>
<dt><a href="https://golang.org/doc/effective_go">Effective Go</a></dt>
<dd>I&rsquo;ve heard positive things about this document.</dd>
<dt><a href="https://golang-for-python-programmers.readthedocs.io/en/latest/about.html">Go for Python Programmers</a></dt>
<dd>Well&hellip; I&rsquo;m a Python programmer and I want to learn Go. Nuff said. ;-)</dd>
<dt><a href="https://gobyexample.com/">Go by Example</a></dt>
<dd>Again practical examples to teach the concepts in Go. The examples are, as far
as I&rsquo;ve seen, relatively short. This is positive because it highlights the
concept at hand, but on the other hand it can be useful to have more complex
examples to get a better understanding of how concepts work together to create a
larger application.</dd>
<dt><a href="https://lets-go.alexedwards.net/">Let&rsquo;s Go! Learn to Build Professional Web Applications With Golang</a></dt>
<dd>This book promises to teach Go while building an application. I find having
practical examples helps me when learning a new programming language.</dd>
<dt><a href="https://github.com/hellerve/programming-talks">Programming Talks</a></dt>
<dd>A (community maintained) list of talks on programming language specifics.</dd>
<dt><a href="https://golang.org/ref/spec">The Go Programming Language Specification</a></dt>
<dd>It&rsquo;s always good to have the specs nearby.</dd>
</dl>
<h2 id="observability-and-monitoring">Observability and monitoring</h2>
<dl>
<dt><a href="https://www.integralist.co.uk/posts/monitoring-best-practices/">Observability and Monitoring Best Practices</a></dt>
<dd>Terminology and a set of best practices by Mark McDonnell.</dd>
<dt><a href="https://netflixtechblog.com/lessons-from-building-observability-tools-at-netflix-7cfafed6ab17">Lessons from Building Observability Tools at Netflix</a></dt>
<dd>Lessons learned from big companies usually make an interesting read. Even
though things might not apply to your situation.</dd>
<dt><a href="https://www.digitalocean.com/community/tutorials/monitoring-for-distributed-and-microservices-deployments">Monitoring for Distributed and Microservices Deployments</a></dt>
<dd>An article about the challenges of distributed architectures and adjustments
needed to be able to respond to incidents in this changed environment.</dd>
<dt><a href="https://medium.com/observability">Observability+</a></dt>
<dd>A blog with a number of interesting articles about observability.</dd>
<dt><a href="https://nickcraver.com/blog/2018/11/29/stack-overflow-how-we-do-monitoring/">Stack Overflow: How We Do Monitoring - 2018 Edition</a></dt>
<dd>This article (and Nick Craver&rsquo;s previous posts by the way) makes for
fascinating reading.</dd>
<dt><a href="https://www.linuxjournal.com/content/why-your-server-monitoring-still-sucks">Why Your Server Monitoring (Still) Sucks</a></dt>
<dd>Five reasons why your current monitoring sucks and what to do about it.</dd>
<dt><a href="https://techbeacon.com/devops/10-monitoring-talks-every-developer-should-watch">10 monitoring talks that every developer should watch</a></dt>
<dd>Enough material in here to learn from.</dd>
</dl>
<h2 id="cloud-services">Cloud services</h2>
<dl>
<dt><a href="https://nodramadevops.com/2019/01/how-many-aws-accounts-do-i-need/">How many AWS accounts do I need?</a></dt>
<dt><a href="https://nodramadevops.com/2019/01/how-should-i-organize-my-aws-accounts/">How should I organize my AWS accounts?</a></dt>
<dd>Two articles published on the #NoDrama DevOps blog about organizing your AWS account(s).</dd>
<dt><a href="https://www.awsadvent.com/2018/12/19/serverless-from-azure-to-aws/">Serverless: From Azure to AWS</a></dt>
<dd>Comparing Azure and AWS serverless offerings.</dd>
</dl>
<h2 id="other-devops-related-articles">Other devops related articles</h2>
<dl>
<dt><a href="https://medium.com/@tonistiigi/advanced-multi-stage-build-patterns-6f741b852fae">Advanced multi-stage build patterns</a></dt>
<dd>Tõnis Tiigi has a number of examples of multi-stage Docker image build
patterns.</dd>
<dt><a href="https://www.digitalocean.com/community/tutorials/how-to-use-git-hooks-to-automate-development-and-deployment-tasks">How To Use Git Hooks To Automate Development and Deployment Tasks</a></dt>
<dd>A list of available Git hooks and a demonstration on how to use hooks to
automate tasks.</dd>
<dt><a href="https://blog.gruntwork.io/open-sourcing-terratest-a-swiss-army-knife-for-testing-infrastructure-code-5d883336fcd5">Open sourcing Terratest: a swiss army knife for testing infrastructure code</a></dt>
<dd>I am using tools like <a href="https://www.terraform.io/">Terraform</a> and
<a href="https://www.packer.io/">Packer</a> quite a bit these days, but testing the code is
still something I&rsquo;m doing manually. Perhaps <a href="https://github.com/gruntwork-io/terratest">Terratest</a> is a nice solution?</dd>
<dt><a href="https://github.com/andrealmar/sre-university">SRE University</a></dt>
<dd>A list of resources related to Site Reliability Engineering.</dd>
<dt><a href="https://www.scalyr.com/blog/site-reliability-engineer">What Does a Site Reliability Engineer Do?</a></dt>
<dd>Activities an Site Reliability Engineer is participating in, according to Erik
Dietrich.</dd>
</dl>
<h2 id="blog-improvements">Blog improvements</h2>
<p>Once I get around to working on this site again, there are a few things I want
to have a look at.</p>
<dl>
<dt><a href="https://matthiasadler.info/blog/isso-comment-integration/">Bye, Bye Disqus - Say Hello to Isso</a></dt>
<dd>I am thinking about replacing the <a href="https://disqus.com/">Disqus</a> comments with
something else. <a href="https://posativ.org/isso/">Isso</a> is a contestant.</dd>
<dt><a href="https://www.sarasoueidan.com/blog/hex-rgb-to-hsl/">On Switching from HEX &amp; RGB to HSL</a></dt>
<dd>Sara Soueidan convinced me in this article that expressing colors in HSL (Hue,
Saturation and Lightness) can be an intuitive way to choose colors. I&rsquo;ll want to
keep this in mind if I overhaul the colors used on this site.</dd>
<dt><a href="https://securitytxt.org/">security.txt</a></dt>
<dd>A (proposed) standard to provide information on how to report security issues.</dd>
<dt><a href="https://www.zachleat.com/web/font-checklist/">The Font Loading Checklist</a></dt>
<dd>I like having pretty (IMHO) fonts for this site. This resource might help me
improve the use of them.</dd>
<dt><a href="https://www.fastly.com/blog/headers-we-dont-want">The headers we don&rsquo;t want</a></dt>
<dd>Time to review the response headers this site is returning.</dd>
</dl>
<h2 id="miscellaneous">Miscellaneous</h2>
<dl>
<dt><a href="https://gchq.github.io/CyberChef/">CyberChef</a></dt>
<dd><q>CyberChef is a simple, intuitive web app for carrying out all manner of
&ldquo;cyber&rdquo; operations within a web browser.</q></dd>
<dt><a href="https://charity.wtf/2019/01/04/engineering-management-the-pendulum-or-the-ladder/">Engineering Management: The Pendulum Or The Ladder</a></dt>
<dd>Another great article by Charity Majors. This time she writes about becoming
an engineering manager and career options.</dd>
<dt><a href="https://web.archive.org/web/20201112013936/https://www.mockingbirdconsulting.co.uk/blog/2019-01-05-hashicorp-at-home/">Hashicorp at Home</a></dt>
<dt><a href="https://web.archive.org/web/20201112020207/https://www.mockingbirdconsulting.co.uk/blog/2019-01-08-hashicorp-at-home-part-2/">Hashicorp at Home - Part 2</a></dt>
<dd>Matt Wallace improved his home network with <a href="https://www.vaultproject.io/">Vault</a>
(managing secret), <a href="https://www.consul.io/">Consul</a> (managing DNS and service
discovery), <a href="https://www.nomadproject.io/">Nomad</a> (managing containers),
<a href="https://traefik.io/">Traefik</a> (dynamic reverse proxy/load balancing) and
<a href="https://www.datadoghq.com/">DataDog</a> (monitoring).</dd>
<dt><a href="https://www.digitalocean.com/community/tutorials/how-to-use-sshfs-to-mount-remote-file-systems-over-ssh">How To Use SSHFS to Mount Remote File Systems Over SSH | DigitalOcean</a></dt>
<dd>Basically what the title says: instructions on how to mount a file system of a
remote machine, using SSH.</dd>
<dt><a href="https://www.oreilly.com/library/view/time-management-for/0596007833/">Time Management for System Administrators</a></dt>
<dd>Something I could get better at: time management. Now to make the time to
actually read this book&hellip;</dd>
</dl>]]></content>
  </entry>
</feed>