DevOpsDays Amsterdam 2016: workshops
Table of Contents
Before the ’normal’ DevOpsDays, there was a day filled with workshops. These are the notes of the workshops that I attended.
Working with Docker & Microsoft Azure Container Service — Mark van Holsteijn (Xebia)
Mark started with a presentation about Microsoft Azure Container Service (ACS) and introduced the core concepts we’d be working with. Those concepts were:
- Mesos: a distributed systems kernel on which ACS is built on to of.
- Marathon: init system of Mesos
- Mesos-DNS: DNS based service discovery
- Marathon-LB: Load balancer
- Chronos: cron subsystem for Mesos
The biggest chunk of the workshop was about getting hands-on experience with Azure Container Service DC/OS.
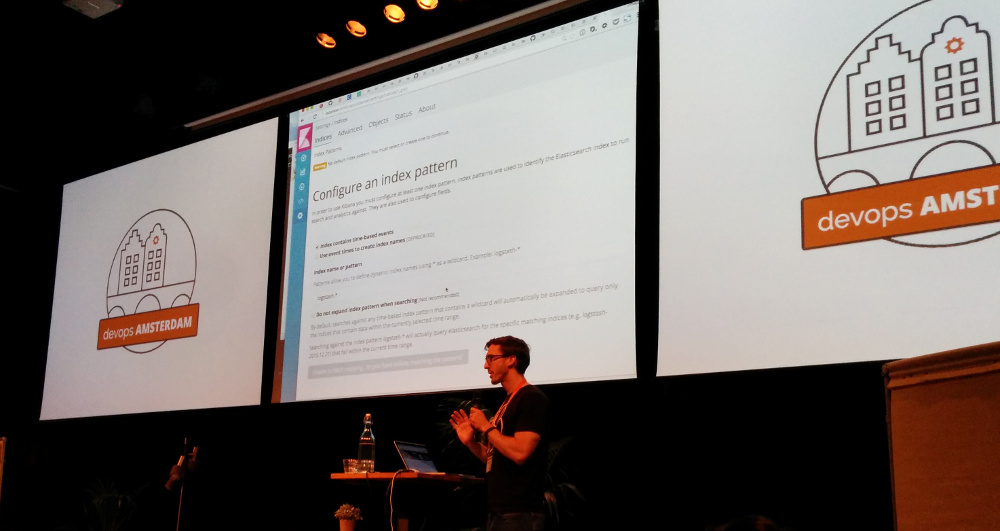
Going Elastic — Philipp Krenn (Elastic)
This workshop began with a bit of history and name-dropping: where did it all start (apparently with Shay Banon creating a cooking app for his wife), what is in the Elastic Stack and who is using their products (e.g. GitHub, Stack Overflow and Salesforce).
What is part of the Elastic Stack? From bottom to top:
- Logstash and Beats to ingest logs and other data
- Elasticsearch to store the data
- Kibana to explore the data
Logstash, Elasticsearch and Kibana combined are known as the “ELK stack”.
While Logstash is working fine, it is kind of heavy. It started out as Ruby application and is now using JRuby. Beats, the newest member of the family, is written in Go and more lightweight. It can insert data directly into Elasticsearch or forward data. Logstash still has its purpose though: it can, for instance, be used to enrich data like adding a country to an IP address.
All the components in the Elastic Stack are open source. “X-Pack” provides commercial plugins: security (authentication, authorisation), alerting (e.g. if we’ve sold more than x dollar, post “Hooray” in Slack), monitoring (the stack itself), graph (to explore data and find out what it is about). Coming soon: reports.
Currently each component has its own version number: the latest version of Elasticsearch is 2.3.3, while Kibana is at version 4.5.1. The result is that you need a matrix to be able to determine which version of X is compatible with which version of Y. To solve this, the next release of all components will be version 5 and the version numbers will be kept in sync.
Hands-on
The configuration for the VM we used for the workshop can be found on
GitHub:
https://github.com/xeraa/vagrant-elastic-stack/. It’s
currently using version 5.0.0-alpha3 but the alpha4 version will
be released soon and the configuration will then be updated.
We’ve used Ansible to install and configure the Elastic Stack components during the workshop.
Kibana
After getting Kibana up and running, we used its console to interact with Elasticsearch.

Internal information can be queried via the “_cat” API, e.g.
“GET /_cat/health” (Note that you can always add the “?v” parameter to
get the headers.)
Our cluster—the VM—only has a single node. That’s why replication has been disabled (since it does not add redundancy and only requires more resources). This is why our cluster in code yellow: the replication factor is 1—there is no replication. Code red: problems. Code green: all data is replicated.
When a node is added, shards and replicas are moved to the new node to spread the load and optimise redundancy. When a node disappears, the replicas are used to restore all shards.
When you add data, Elasticsearch will automatically create a schema for you. But in a production environment you do not want to rely on that and you would want to manually define your schema.
To run a query, you ask one node and it gathers and merges the data from all nodes. The replicas are also used to answer the query. So if you have a high search load, you might want to increase the number of replicas. This will not help when writing is a bottleneck.
Example queries:
- See all indexes: “
GET /_cat/indices?v” - See all shards: “
GET /_cat/shards?v”
You can query endpoints on multiple levels:
/_search: Search all indexes/movies/_search/: Only movies index/movies/movie/_search: Only movie documents.
The more specific the endpoint, the faster the query.
Queries are for full text searching (case insensitive) and results have a certain relevance. Filters don’t do scoring and are just hard constrains.
The relevance score is determined via a formula in which (amongst other things) term frequency and inverted document frequency are used. Term frequency is what you would expect: if a search term is present more often, the relevance of the document is higher. Inverted document frequency means that the least common term is the most important one for calculating the relevance. In other words: terms that are less common will become more important than terms that occur more frequently.
Logstash / Beats
There are community Beats which support more network protocols than included out of the box.
Beats provide sensible, default dashboards for Kibana.
Ansible, best practices — Bas Meijer (Independent Consultant)
Bas had prepared a bunch of lessons for us to get introduced to Ansible. they are on GitHub: https://github.com/bbaassssiiee/lunchbox.
For this workshop we used Vagrant and VirtualBox again, just like the
previous workshop. Bas used the dockpack/centos6 box because it is
hardened.
During the workshop I learned about a couple of useful Vagrant plugins:
Another tip: I should look into the Lookups plugin for Ansible.
If you want to attend more Ansible gatherings, go to an Ansible Benelux meetup.