Microsoft Ignite | The Tour: Amsterdam — day two
Table of Contents
On the second day of Microsoft Ignite | The Tour: Amsterdam I attended talks in the “Operating applications and infrastructure in the cloud” learning path.
(On the first day I followed the sessions of the “Building your application for the cloud” learning path.)

Modernizing your infrastructure: moving to Infrastructure as Code (IaC) — Emily Freeman
Operations is changing—modernizing. DevOps reduces or eliminates the friction between the development and operations teams.
One way of defining DevOps is with the CALMS acronym:
- Culture
- Automation
- Lean
- Measurement
- Sharing
SRE has evolved beyond its original form. SRE can be seen as a prescriptive implementation of DevOps. It has a focus on deploying and maintaining applications.
About failure:
In the cloud, sometimes it is rainy.
If you are using the cloud, you are using APIs continuously. This allows us to automate a lot of things. And do configuration via (YAML) files which can be version controlled. This gives us repeatability and reliability.
Toil is defined as manual, repetitive work. Automation removes the toil. By creating code to do the work, we can reuse it.
Azure Resource Manager templates: you can manually deploy infrastructure and then view the template from within the Azure portal. This template is a configuration file which you can store and use over and over again.
Deploying small batches of code is key. The risk of small changes is less than having big (and many) changes. Small batches also make it simpler to identify bugs. Releasing often makes sure feedback on changes is received faster.
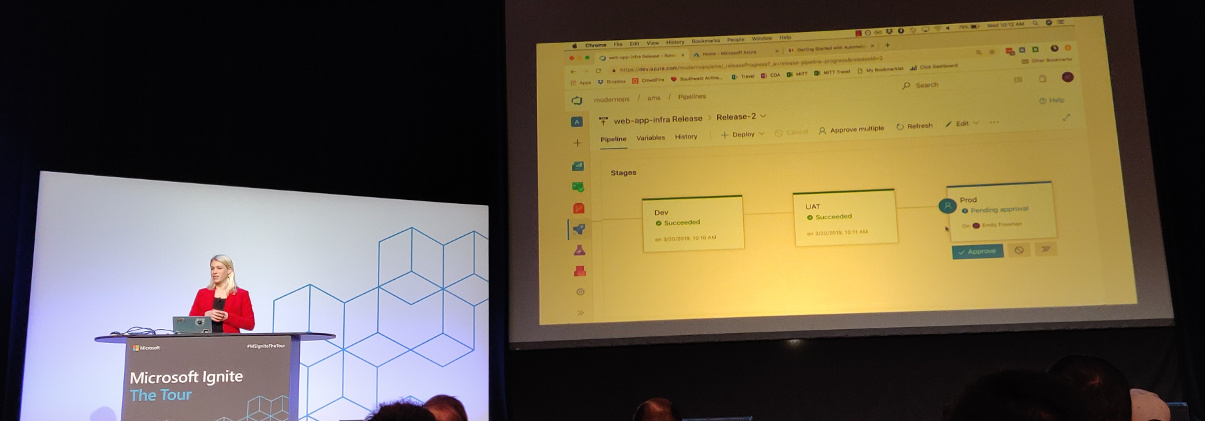
Microsoft works hard to make sure that Azure Pipelines work with the tools you already use.
Additional resources:
Monitoring your infrastructure and applications in production — Jason Hand
Why, what and how do we monitor?
Let’s first have a look at a definition of SRE:
Site Reliability Engineering is an engineering discipline devoted to helping an organization sustainably achieve the appropriate level of reliability in their systems, services, and products.
Note the terms “appropriate” and “reliability.” Hundred percent reliability is expensive but not always needed. For planes and pacemakers you want absolute reliability. For applications, this usually is not needed. Ask yourself what the parts of reliability are that you want to be concerned with.
Why monitor?
- Are apps doing what we expect from them?
- Are apps doing what others (customers) expect?
- Are we meeting our goals or at least moving in the right direction?
- Our systems are constantly in change. What is happening with these changes?
Monitoring is the most important part of reliability.
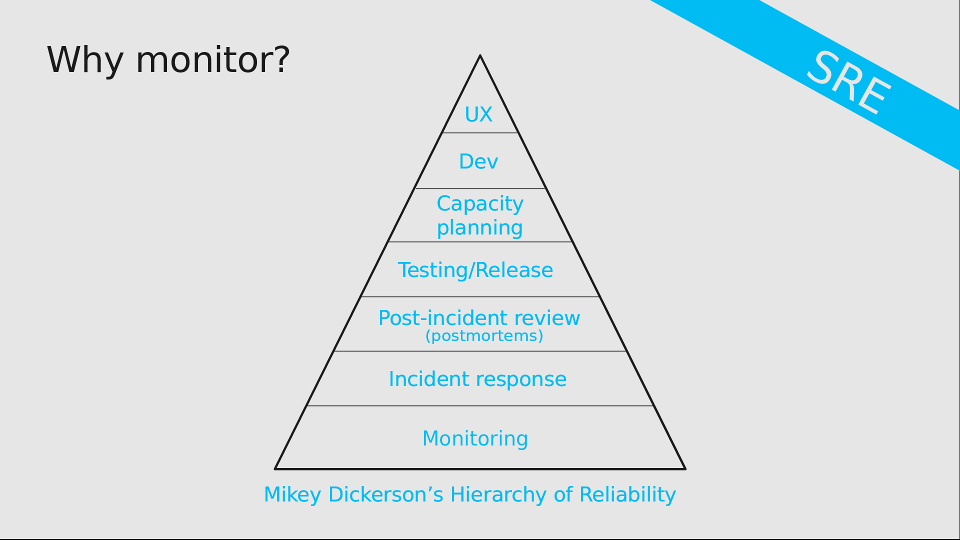
Source: sheets from this presentation
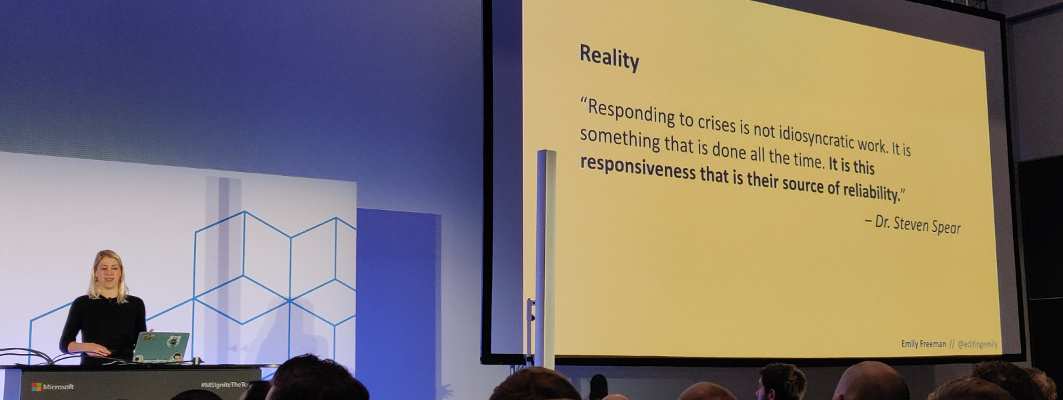
The difference between reacting and responding to incidents is being prepared or not. You’ll want to be prepared to be able to respond, not just react.
Some organizations perform root cause analyses after failures. Complex systems usually don’t have a single root cause though—more often than not it is a combination of causes. Since having more than one root cause is a contradiction in terms, Jason much rather talks about “post-incident reviews.”
Back to the term reliability. This can be measured in a lot of ways. To name a few:
- Availability: will the system respond when I ask it something?
- Latency: “slow is the new down” (we don’t have the time for slow applications).
- Throughput: can you get the volume of data from one point to another in a way you expect?
- Coverage: can a process plough through all the available data?
- Correctness: did it do what it was supposed to do?
- Fidelity: See for example Netflix: perhaps the search is temporarily unavailable but you can still scroll through the catalog and watch a movie.
- Freshness: is the data you get the most recent stuff?
- Durability: if you write data, can you retrieve it again?
It is not just about what we see, but also about what our customer experiences. We should put the customer first and look at things from their perspective.
Service Level Indicators (SLIs) are a ratio/proportion. For instance: the number of successful HTTP calls divided by the total number of HTTP calls.
But where do the numbers come from? A few options:
- Reported by the server
- Reported by clients
- Reported by the application
- Reported by the front-end (load balancer)
- Reported by our monitoring / testing infrastructure
You need to include the way you measure in the SLI.
There is no “right way” to measure things, but there are trade-offs. And you need to be aware of them. Ideally you should monitor as close to the user as possible.
The SLIs are the measurements. The Service Level Objectives (SLOs) determine what is acceptable. If the SLI (indicator) dips below the SLO (objective), we need to get people involved.
How to build a good SLO? Take the thing to monitor (e.g. HTTP requests), look at the SLI proportions and add a time statement. An example: “90% of the HTTP requests as reported by the load balancer succeeded in the last 30 day window.” You can make your SLOs more complex if needed, e.g. by having a lower and upper bound.
Alert on actionable things. Alerts are not logs, notifications, heartbeats or normal situations. Alerts are about things a person needs to go do. And not just any person, but the right person. It should not be something that can be automated. Ideally alerts are pretty simple and include:
- Where is this coming from?
- Which SLO is breached?
- What is the impact for the customer?
- What systems are impacted?
- What are the first couple of steps to take?
Possible future direction of monitoring:
- There’s no one silver bullet. We’ll probably want to integrate multiple monitoring solutions.
- Modular monitoring
- Aggregate monitoring (measure the system as a whole)
- Correlation and anomaly detection (AI / ML)
- Monitoring the monitoring
Additional resources:
Troubleshooting failure in the cloud — Jason Hand
Our systems have become more complex than they have been in the past. We are now using microservices, containers, functions, etc. Our focus for this session: going from the detection phase (previous session) to the response phase.
Before talking about how to detect something is wrong, you need to define that you mean with “wrong.”
Azure has a nice toolbox to help you:
- Azure monitor
- Service health alerts
- Azure Application Insights
- Diagnostic logs (application and system)
- Live debugging via log streams
- Log Analytics
The first question is often: is it just me? Azure (and the other cloud providers) can also have problems. The Azure Resource Health page in the Service Health section shows you if your components have problems. It even has historical data. But because you don’t want to stare at a dashboard all day long, you’ll want to also have health alerts for when something goes wrong.
Guidance for creating service health alerts:
- Don’t create too many, but also not too few. Find your sweet spot.
- Make sure they don’t overlap (to avoid confusion).
- Don’t alert on non-production environments.
- Keep the responders in mind (what would they want).
- Separate alerts for issues, planned maintenance and advisories.
Application Map shows components and how they interact with each other. Where is slowness? Where are problems?
You will need to enable diagnostic logging to get a bunch of logs. And you don’t have to go to the portal, you can use the CLI tool to download them. You can then use a separate tool to analyse the logs.
az webapp log download --resource-group <name> --name <webapp name>
Azure Cloud Shell allows you to have a terminal session in your browser. You don’t need your local CLI.
Use Log Analytics for more complex troubleshooting. It collects a lot of information from a log of sources.
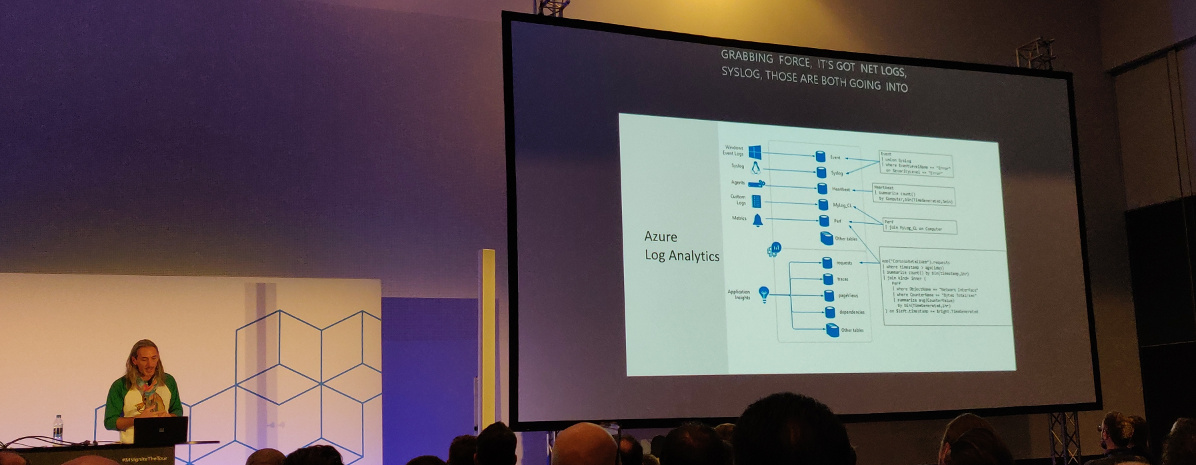
You’ll need to use the Kusto Query Language to get to the information. Queries start with a table, then commands to filter, sort, specify time range, etc. Once you have queries that answer your questions, you can keep them handy by saving them right in the Azure portal.
Azure Monitor Workbooks and Troubleshooting Guides (a.k.a. runbooks) combine text, queries, metrics and parameters into reports. This helps with onboarding and will also help your first responders.
Workbooks are editable by others that have access to the same resources. Troubleshooting Guides are like workbooks, but for dealing with problems.
Future for troubleshooting:
- Observability (OpenCensus and other distributed tracing tools)
- Anomaly detection
Additional resources:
Scaling for growth and resiliency — Jeramiah Dooley
How do we take an application and how do we scale it? Bigger picture: asking a lot of “why?” questions.
Do we need to scale out our application and the underlying infrastructure? Maybe.
- Perhaps we should first check if the application is buggy (memory leaks) or if we can optimize it for performance (e.g. database queries).
- Is there a temporary (or artificial) reason the site has a spike?
- Is there unused capacity we can move around?
- Scaling costs money, but if we don’t do it we give the customers a bad experience. This is a risk vs expense issue.
- When is the application no longer meeting our expectations (SLOs)?
We need to factor for both the anticipated and unanticipated spikes.
One can scale up (vertical) or out (horizontal). Scaling up is adding more resources (CPU, memory) to an instance. Scaling out is adding more machines. When scaling out, the application needs to be aware of the change (additional or less instances).
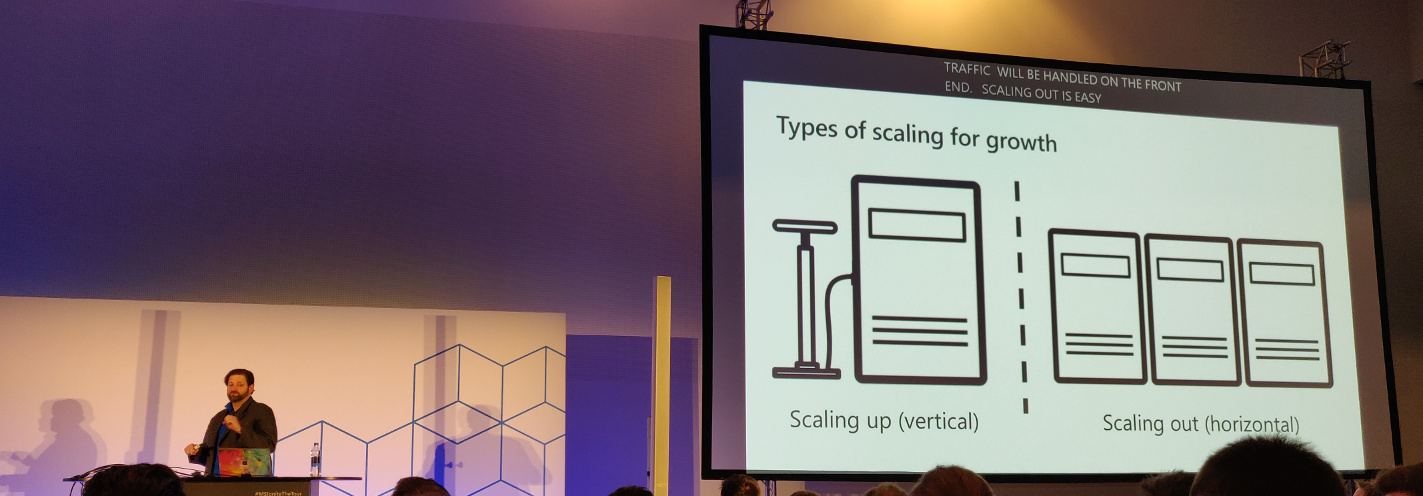
You might not want to scale just one portion of an app since it can cause problems in another part of the app.
Autoscaling can trigger on quite specific conditions: only today if CPU > 80% add more instances.
But should you use autoscaling?
- Do you know your app? When do you need to add more resources? How will your app respond? How quickly? What happens when you scale down?
- Do you know your traffic?
- Autoscaling also has its limits. (E.g. there is going to be a delay.)
- Do you understand the metrics that matter?
It’s not magic, it’s just automation.
An autoscaling profile has:
- Capacity:
- Minimum
- Maximum
- Default
- Triggers (a metric we want to trigger on and a value for that metric)
- Recurrence (when do we want this to happen? Always? First week of the month?)
Warnings with regards to autoscaling:
- Scaling out will happen when any of the triggers are met.
- Scaling in will trigger when all triggers are met.
- Autoscaling always wins over manual scaling settings.
Okay, we know how to handle load. But do we know what to do when we have a localized failure (e.g. a data center that goes down)? Use:
- Multiple regions/geographies
- Region pairs
- Availability zones
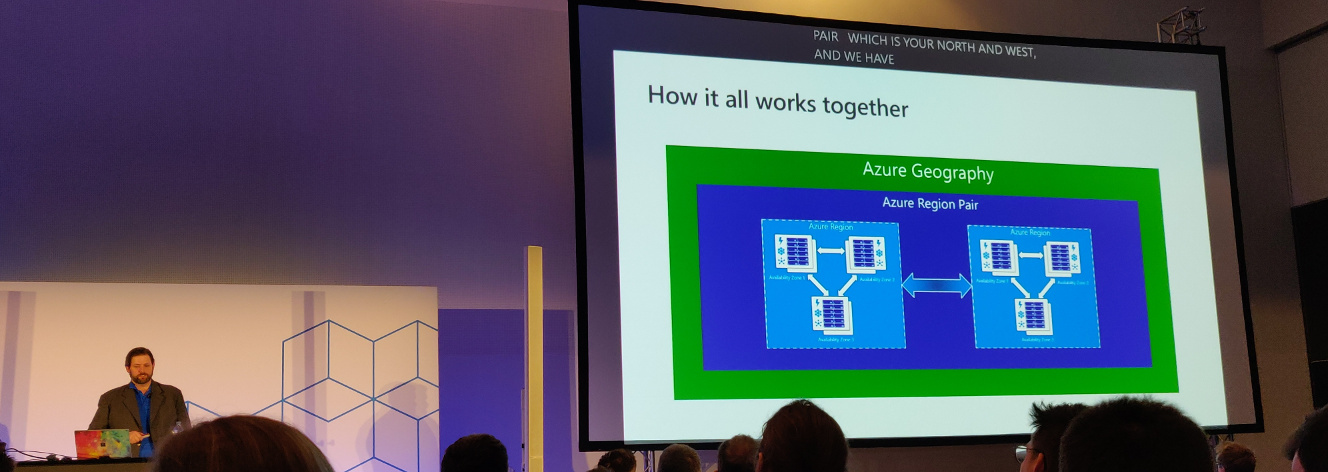
Jeramiah Dooley about the relation between Geography, Region Pairs, Regions and Availability Zones
- Global HTTP load balancer with instance failover
- Bonuses:
- SSL offloading
- Firewall and DDoS Protections
- Central control plane for traffic orchestration
Future possible directions for scaling:
- Content delivery networks (CDNs)
- Failovers
- Traffic shaping
- Draining data centers
Additional resources:
- Code (Tip: the code apparently has a very nice deployment script.)
- Scale up an app in Azure
- Get started with Autoscale in Azure
- Business continuity and disaster recovery (BCDR): Azure Paired Regions
- What is Azure Front Door Service?
Responding to and learning from failure — Emily Freeman
Failure is inevitable.
Teach people how to solve problems. It will prevent you from being woken up for everything at night.
Having to react to failure leads to:
- Unplanned work
- Context switching
- Confusion
- Increased time to repair
We tolerate a certain level of failure every day. Things that are not fine however:
- Alerts to inbox
- Alerts to a common channel where memes are combined with alerts since you’ll miss the important stuff
- Shoulder tapping
- Delays in communication
- Tiered and off-shore support
- Network Operations Center
We can borrow concepts from other disciplines. Like creating a space to communicate and collaborate. Ideally there is a single space for all communication for an incident; a space devoted to that single incident. The benefits of having such a space: you’ll have a time stamped record (which helps the post-incident review), and it focusses communication.
Train your first responders and provide them with context and clear escalation procedures.
Update your stakeholders throughout the incident.
Important when alerting is adding a severity of the incident:
- Sev1 (critical): complete outage
- Sev2 (critical): major functionality broken, revenue affected
- Sev3 (warning): minor problem
- Sev4 (warning): redundant component failure
- Sev5 (info): false alarm or unactionable alert
The life cycle of an incident:
- Detection: discovering that there is an issue. You’ll have to figure out what is wrong ASAP.
- Response: about 1/3 of your time is spent in this phase. The incident commander (IC) is the person in charge of the incident response. A communication chief (or scribe, or whatever you call this person) documents the situation for a historical record. Don’t use this to place blame, but to analyze what happened.
- Remediation: you know what went wrong and how to fix it. Always under-promise and over-deliver in your timeline. ChatOps tools might help to remediate a situation.
- Analysis: host a post-incident review to learn from what happened. The goal is not to produce artifacts, instead the goal is to maximize organizational learning. Prevent a similar incident in the future. Record counter measures and assign a date and responsible person.
- Readiness: prepare for the future.
Incidents are not linear and neither is the response.
The last two phases are often forgotten while they are the most important. Since these will prevent the same failure in the future from happening.
Additional resources:
- Code
- Rasmussen and practical drift
- Azure Logic Apps Documentation (concerning building automated workflows)
- Overview of alerts in Microsoft Azure
- Build a chat bot with the Azure Bot Service