All Day DevOps
Table of Contents
All Day DevOps is an online conference which lasts for 24 hours. With 150 sessions across 5 tracks, there’s enough content to consume.
(As with all my recent conference notes: these are just notes, not complete summaries.)

#adidoescode Where DevOps Meets The Sporting Goods Industry — Fernando Cornago
Adidas is a big company, about 57,000 employees. Software is also having an impact on sports, e.g. registering your performance, etc. Is Adidas already a software company? Definitely not, but they should start behaving as if they are. They are building their applications 10,000 times a day.
New book from Gene Kim (the author of The Phoenix Project): The Unicorn Project. Expected end of November 2019.
The platform you need to be able to accelerate you business should be:
- on demand and self-service
- scalable and elastic
- pay per use (which helps with the efficiency mindset)
- transparent and measurable (observability)
- open source + inner source
To improve sales, Adidas’ platform can run where their customers are (globally) and can scale up if needed and scale down again when possible.
Making use of data is key. The data is seen as a baton in a relay race and makes its way through the teams. A large part of time consumed in creating a service is spent at looking at the data. The data is used to train their AI systems.
You want to deliver value and make sure that things are working. Testing needs to be done on the physical level (the actual products that are being sold), but also on the virtual level: the IT platform also needs to perform and work as expected.
At Adidas they went from having a couple of “DevOps engineers” to having a DevOps culture in all teams. This removed bottlenecks and allowed them to grow faster. They have substantially reduced costs and manual testing and improved drastically on time to production.
Multi Cloud “day-to-day” DevOps Power Tools — Ronen Freeman
About the relation between SRE (Site Reliability Engineering) and DevOps: SRE is an implementation of DevOps.
What defines a great SRE:
- Quality
- Be curious
- Stay up to date
- Attend events
- Tinker with things
- Adapt to change (change will happen, anticipate it, monitor it, adapt to it and prepare for the next change)
- Learn:
learn fast so you may promptly begin again
- Laziness: automate, but ask your self the question whether it will actually save time or not
- Be curious
- Support
- Googling is an art form
- You’ll learn the answer itself but also discover things in the process
- There are numerous forums (for example: Stack Overflow, GitHub, Slack, etc)
- Have a daily standup
- Pass on knowledge
- Tools: there are a number of areas to consider:
- Code: Bash
- Package: Docker
- Deliver: Concourse
- Platform:
- Infrastructure: Kubernetes (
relatively simple to get started with
); GKE is the most mature - Configuration tool: Terraform
- Infrastructure: Kubernetes (
- Monitor: Google Stackdriver (since already running on GKE)
There’s a demo app: https://github.com/Darillium/addo-demo
How to Run Smarter in Production: Getting Started with Site Reliability Engineering — Jennifer Petoff
Software engineering is focussed on design and building, not about running the application.
There are multiple places in organizations where friction occurs:
- Business vs development: this is addressed by Agile
- Development vs operations: this friction is addressed by DevOps
SRE is a bridge between business, development and operations.
Four key SRE principles:
- SRE needs Service Level Objectives (SLOs) with consequences
- SREs must have time to improve the world
- SRE teams must be able to regulate their workload
- Failure is an opportunity to learn (having a blamelessness culture)
Some terminology:
- Service Level Objectives (SLOs): a goal you want to achieve. For example, you may want to set an uptime SLO, but typically you want to dig deeper, like 99.99% of HTTP requests should succeed with a “200 OK” response. You want to measure something your user cares about.
- Service Level Agreements (SLAs): these are “handshakes between companies,” contractual guarantees.
- Error budget: the gap between your SLO and perfect reliability. E.g. the allowed downtime to still match your 99.9% uptime SLO.
- Error budget policy: this policy describes what do you do when you have spent your error budget. Example: no new features until within your error budget again.
100% is the wrong reliability target for basically everything
SRE is about balancing between reliability, engineering time, delivery speed and costs.
Note that you can have an error budget policy without even hiring a single SRE. You can already start with an SLO.
SLOs and error budgets are a necessary first step if you want to improve the situation.
When talking about making tomorrow better than today, you need to address toil (work that needs to be done that is manual, repetitive, automatable and does not add value). If your SRE team is spending time on toil, they are basically an ops team. Instead you want them to make the system more robust and improve the operability of the system.
One way to be able to have your SRE team regulate their workload is to put them in a different part of the organization.
If you want to start with SRE, start with SLOs and let your SRE team own the most critical system first. Don’t make them responsible for all systems at once. Let them deal with the most important systems first. Once they have that under control (removed toil, etc), they can take on more work.
You need leadership buy-in for every aspect of SRE work.
Aim for reliability and consistency upfront. SRE teams should consult on architectural discussions to get to resilient systems.
SRE teams can benefit from automation:
- Eliminate toil
- Capacity planning (auto scaling instead of forecasting)
- To fix issues: if you can write a playbook, you can automate it.
SRE teams embrace failure:
- Setting SLO less than 100%
- Blamelessness at all levels
- Learning from failure
- Make the postmortems available so other teams can also learn from them
Resources (books):
Everybody Gets A Staging Environment! — Yaron Idan
How can you give an isolated and secure staging environment for each developer? If you follow the path Yaron’s company (Soluto) took, prepare for a rocky transition, getting used to new terminology when moving to Kubernetes and users that can get upset at first.
Their first step: automate the entire process. The realized they needed onboarding documentation and templates. They used Helm for the templates.
Deploy feature branches to the production environment. When developers open a pull request, the CI/CD tool adds a link to where this PR is deployed. This empowers the developers and provides a sense of security. This accelerated the way the developers built features and the adoption of the platform by the company.
The benefits:
- Code is fit for production during entire life cycle of the feature branch.
- Makes performance testing easier (after all: it’s deployed on the production environment).
- Easier to share things with the stakeholders and thus improves collaboration.
- You can deploy an entire set of microservices.
The tools used for their implementation:
- GitHub (VCS)
- Docker (code as configuration)
- CodeFresh (CI)
- Helm (CD)
- Kubernetes (production platform)
You can swap the aforementioned tools with other tools, but you must be able to automate them and make sure that they work with the push of a single button.
GitHub repository for the demo: https://github.com/yaron-idan/staging-environments-example
DevOps to the Next Level with Serverless ChatOps — Jan de Vries
What DevOps is about:
- Shipping code
- Adding value
- Do this continuously
It’s not about:
- Adding additional load to your team
- Lowering quality
- More support calls
- Slow response times when there are errors
One option is to send emails if something is wrong. But these emails are slow (knowing that there was an issue yesterday is too late) and it generates a lot of noise. Monitoring dashboards are nice, but you have to actively look at them to detect if there’s something wrong.
A better solution is using chat applications (like Microsoft Teams or Slack).
Your first step is to emit events when something fails (in Azure you can sent such events to Event Grid). Next, you have to subscribe to these events/topics. You can use an Azure Function for this and then have it post an actionable message to Teams.
These messages can have buttons to take immediate action (e.g. post to a web API like an Azure Function) to recover from the problem. The output from the recover action can also send events, so you can get another notification in your chat application about the result.
GitHub repository with demo code: https://github.com/Jandev/ServerlessDevOps
Building Modular Infrastructure in Code — Fergal Dearle
Why use infrastructure as code (IaC)?
- Fergal is a fan of immutable infrastructure and the pets vs cattle analogy (which goes further than just servers)
- Everything as code
- You don’t have to log into a server via SSH to fix things
- Better testability and maintainability
The DevOps handbook (part III, chapter 9) talks about on demand spinning up a production-like environment. The only way to do this is to use IaC.
First thing is understanding your infrastructure (VPC, networking, DNS, services, database). Look at patterns like requestor/broker. Use these patterns to create modular stacks.
Patterns:
- Singleton stack pattern: one stack per instance. But this is actually an anti-pattern because you are mixing configuration and infrastructure.
- Multiheaded stack pattern: multiple stacks in single project, config built in.
- Template stack pattern: single stack, config separate, multiple instances from that template
Stack templates & stack instances:
- Reusable template that implements building blocks
- Appropriate tags
- Must be able to uniquely identify instances (namespacing)
Stay clear of monoliths
Monoliths are stacks with everything in them. This is one end of the spectrum. The other end is to have one service per stack. You’ll probably will want to end up somewhere in between, where you have a component stack (e.g. with a requestor/broker combination). And then you can combine those stacks.
Static stack inputs: environment names, app names. You should externalize this config from your stack, e.g. by feeding these parameters via the command line or use the SSM Param Store and Secrets Manager.
(Note to self: Fergal mentioned Sceptre. Check what this is about.)
Common problems:
- Drift can happen, especially if you also make manual changes (don’t!)
- Updates are not forward compatible
- Region incompatibilities
Best practices:
- Only use template stacks
- Use layered and component
- Externalize config
- Test, test, test!
- Only use automation, no manual steps
Crossing The River By Feeling The Stones — Simon Wardley
In The Art of War Sun Tzu discusses five fundamental factors which you should consider:
- Purpose
- Landscape
- Climate
- Doctrine
- Leadership
John Boyd developed the OODA loop, which cycles through the following:
- Observe
- Orient
- Decide
- Act
You can combine these cycles:
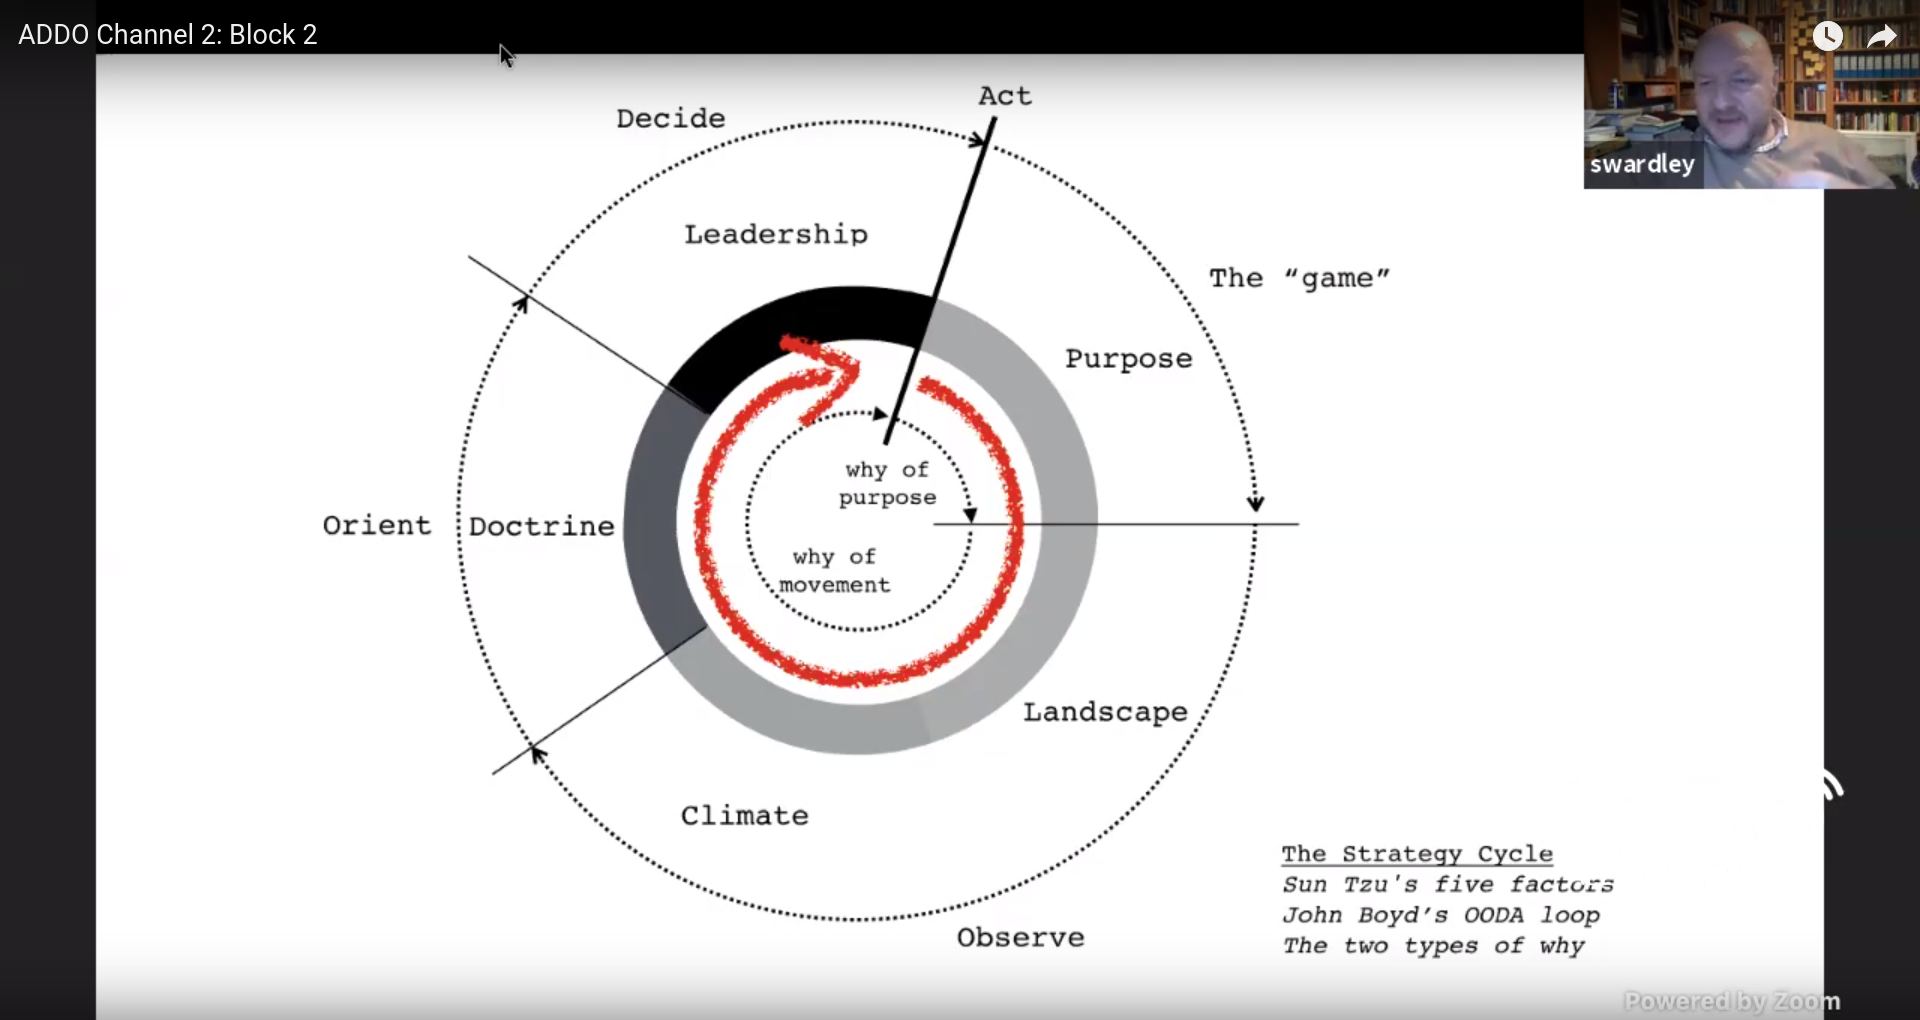
By moving we learn, as long as we can observe the environment.
Maps are ways to:
- explore
- communicate
- share understanding
- de-personalize
Graphs are not maps. Identical graphs can spatially be different. On a map, space has meaning, in a graph not. And because space has meaning, we can explore, e.g. by asking ourselves the question “what if we go in that direction?”
What makes a map?
- Anchor (compass)
- Position (places, relative to the compass)
- Consistency of movement (going to right below means go to south-east, assuming on this map “up” is north)
In business there are a lot of maps, e.g. a systems diagram. But almost everything in business we call a map actually is a graph. Which means we don’t have a sense of the landscape.
How do you create a map for a business? Start with the anchors, e.g. business and customers. Work from there to get all related components and express them in a chain of needs.
But how do you position those components? We can use “visibility” as an analogy of distance. You can use this to create a “partial ordered chain of needs.”
And what about movement? You can describe movement as a chain of changes. But how do you do that? You can order components based on their evolutionary stage. Are they in the genesis stage, do we use custom built components, do we have standard products or can we consider it a commodity?
By combining these we can create a map of components by using the position (visibility) on the y-axis and the movement (evolution) on the x-axis.
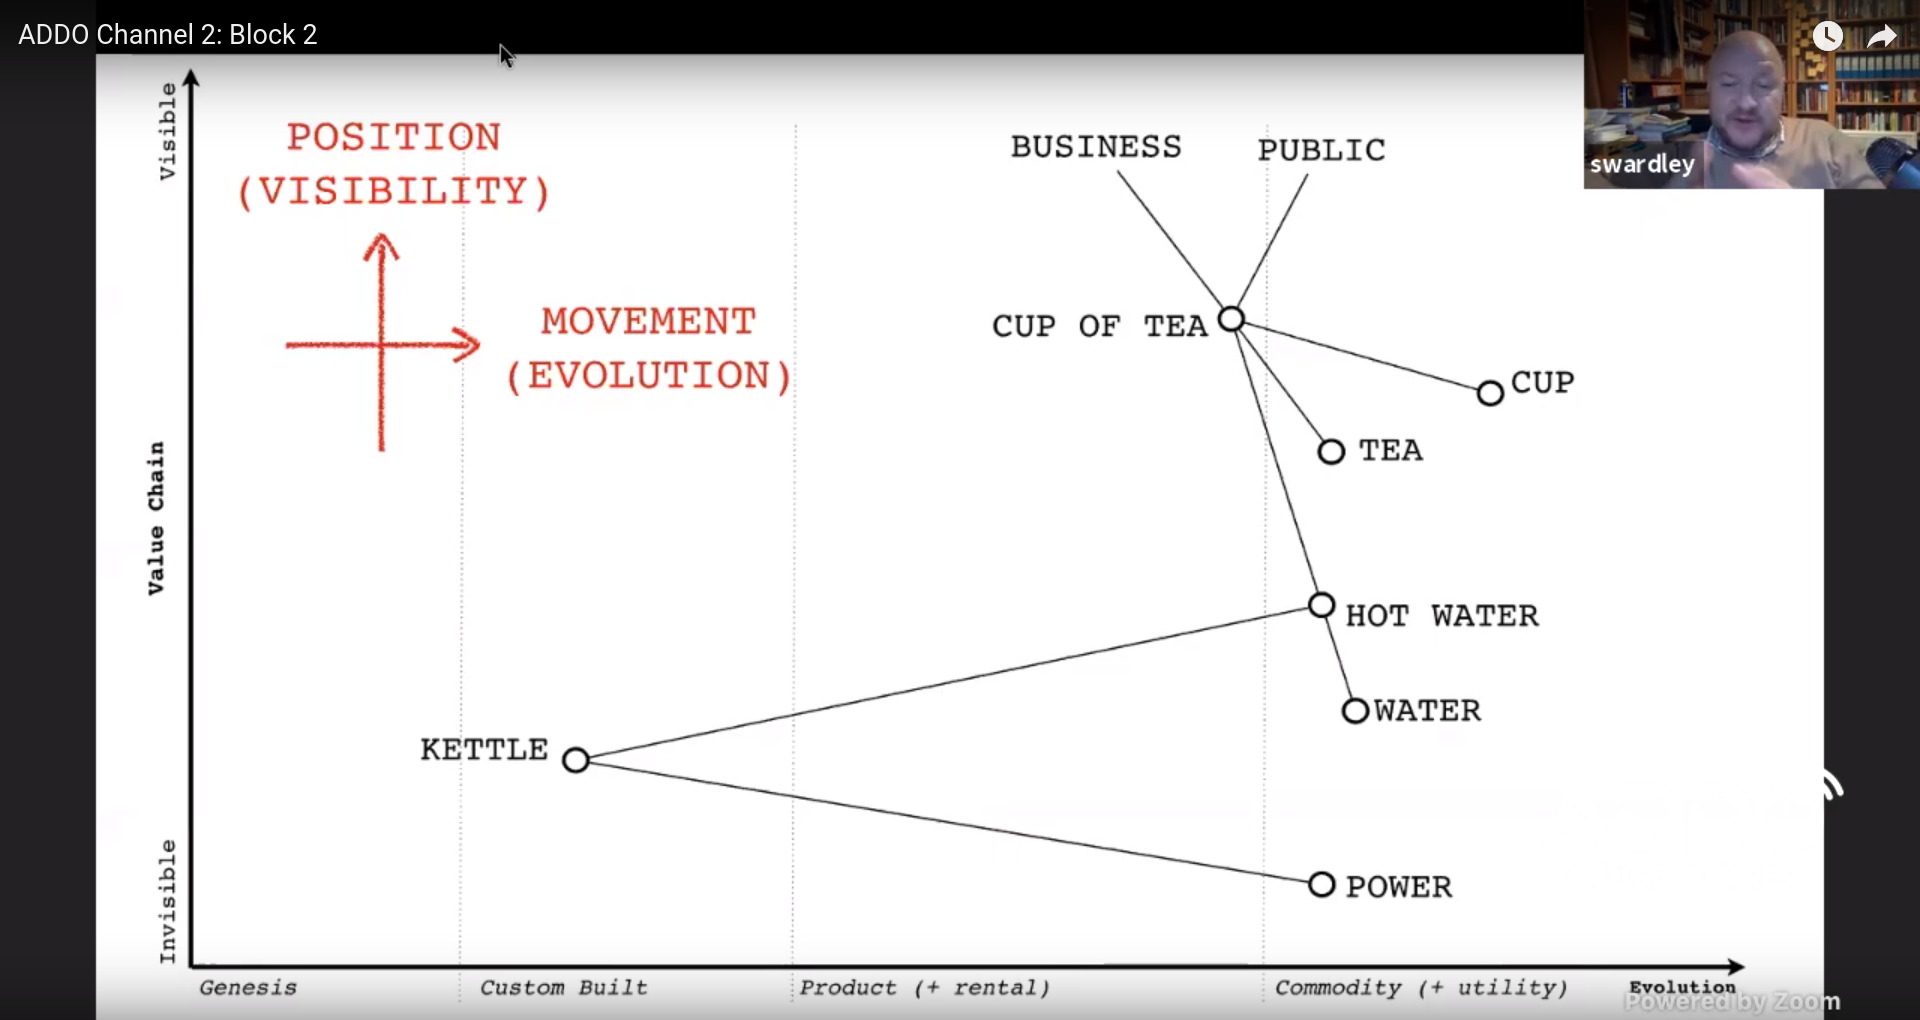
Simon Wardley shows a map of a fictional company selling cups of tea
You can add intent (evolutionary flow) to your map, e.g. move a component from custom built to using a commodity.
By using such a map, you can de-personalize discussions since now you talk about the map, not a story.
Simon told a story of a company that wanted to invest in robots to do manual labour. After putting their business in a map, the problem became clear: they were using custom built racks and as a result needed to customize their servers because they would not fit their non-standard rack. Because the market had changed since the company started, they could switch to commodity (cloud) and as a result also did not need robots.
But keep this in mind:
All maps are imperfect representations of a space
Deploying Microservices to AWS Fargate — Ariane Gadd
At KPMG they moved a project from using Amazon EC2 to AWS Fargate. They also replaced CloudFormation with Terraform for standardization.
Why managed container services and not EKS?
- Immutable deployments
- Cluster provisioning handled by Fargate
- Only pay for what you execute
- No OS patching
- Smaller attack service
They used ECS deploy to deploy containers to Fargate.
Why was the customer okay with this change?
- They were already familiar with Docker
- Fargate has integrations with ECS and ECR.
- Overhead of managing EC2 vs cost of AWS Fargate
Fargate runs in your own VPC so you own the network, etc.
The microservices for this project are placed behind an application load balancer (ALB) using AWS Web Application Firewall (WAF) and TLS termination. Logs are sent to AWS CloudWatch Logs. They used Anchor for end-to-end container security and compliance.
Benefits of AWS for KPMG:
- Cost reduction (automation tools were already in place, they already used Lambda for account creation and had reserved instances)
- Speed of delivery
- Allows collaboration with developers (automation, DevOps).
- 70% of the engineers were already AWS certified.
Automate Everyday Tasks with Functions — Sean O’Dell
Common use cases for serverless applications are things like web applications (such as static websites), data processing, Amazon Alexa (skills) and chatbots.
Not every workload should run in a serverless fashion
Organizational and application context are relevant. Serverless is just another option. You pick what is right for your use case as serverless is not a silver bullet.
AWS Lambda in a nutshell: there is an event source (e.g. a state change in data or a resource), which triggers a function, which in turn interacts with a service.
GitHub repository with examples: https://github.com/vmwarecloudadvocacy/cloudhealth-lambda-functions
(Note to self: check Amplify)
Beyond dev & ops — Patrick Debois
The DevOps pipeline usually starts at the backlog. But what happens before? And how does that influence people outside the engineering department?
Patrick joined a startup five years ago. He fixed the DevOps pipeline. After a while the organization wanted to sell a product.
The book The Machine by Justin Roff-March describes “the agile version of sales.”
Sales had more in common with IT than Patrick expected. The sales pipeline looked like a Kanban board. Sales people are also on call, especially if you do international sales. If we can deliver faster, this increases the chance of a sale. Sales persons are actually mind readers; this reminded Patrick how IT people feel about tickets in the backlog: “what is meant with this ticket, what do the customers actually want?”
Thinking about the life of the project after it has been delivered, in terms of maintenance and operational costs, is important. Doing this upfront, is beneficial for the project.
The biggest impact sales had on IT was the never ending hammer of “can you make things simpler?” Sales can help you with making your design less complex. Together you can determine what actually adds value for the customer.
Having publicly available documentation really helps and makes it easier to sell the product. Getting the customers on Slack also helped. This showed that the company was willing to listen and help. This also helps sales.
After sales, the marketing department got focus. Patrick has seen the most interesting automation within the marketing department (e.g. email sending). Marketing has a lot of fancy metrics and tools to measure stuff; did they invent metrics? The IT department can help marketing by providing information. Conferences are also a marketing instrument. Marketing also has CALMS; they do very similar things.
We’ve got sales and marketing covered, but for a lot of things we still need budgets. To budget things, you also need to estimate things. Finance knows what it is to be on the receiving end of tickets where you have to guess what is going on.
Sometimes you need to buy things. Patrick looked into agile procurement. Lots of stuff has to be figured out: is it a fit? is there a way to be partners?
Serverless is a manifestation of servicefull, where you use a lot of services, so you can focus on your domain instead of having to build everything yourself.
With cloud services there doesn’t have to be communication initially: you read the website, check the documentation, pull your credit card and start with a proof of concept. Communication is still important. You have to treat your suppliers with respect.
HR: how does your company support hiring people? Have people join the team for some actual work to see if they are a good fit or not.
Do you know what pair programming is? Well, mob programming is a whole other level of collaborating. (Note that it’s more than just have one person typing and a bunch of other people commenting—it has a lot of patterns going on.) Teams can get very enthusiastic about this and can be very productive the first week. But if they are not careful, the team is exhausted the next week. You need to develop a sustainable pace.
Patrick learned a lot from talking to the different departments. They are solving similar problems as IT is.
Reading tip: Company-wide Agility with Beyond Budgeting, Open Space & Sociocracy by Jutta Eckstein and John Buck.
The Open Source Observability Toolkit — Mickey Boxell
Some characteristics of a modern application:
- Microservices
- Distributed
- Multiple programming languages
- Scalable
- Ephemeral
This brings new challenges compared to the old situation with a monolithic application running on a single machine. You still want to address threats to customer satisfaction. But the old debugging solutions we used for a monolith will not work.
Observability means designing and operating a more visible system. This includes systems that can explain themselves without you having to deploy new code. The tools help you understand the difference between a healthy and unhealthy system.
Modern, distributed systems will experience failures.
Observability takes a holistic approach that recognizes the impact an issue has on the business as a whole. Outages affect the whole business, which should be able to react. Observability gives tools to address issues when they arrive.
External outputs:
- Logs
- Metrics
- Traces
These outputs don’t make your system more observable, but they can be part of the holistic approach. They can help you with e.g. a root cause analysis.
Monitoring tells you whether a system is working, observability lets you ask why it isn’t working.
Key SRE concepts:
- Service Level Indictors (SLIs; what are you measuring), Service Level Objectives (SLOs; what should the values be), Service Level Agreements (SLAs; defines the planned reaction if the objectives are not met).
- Subset of Google’s golden SRE signals: RED (Rate, Errors, Duration).
- Mean Time To Failure (MTTF) and Mean Time To Repair (MTTR)
Users are comfortable with a certain level of imperfection. A site that is a bit slow sometimes, is less annoying than a shopping cart that sometimes looses its content. Use this to determine what you’ll spend your time on first.
Logging
Logging is the most fundamental pillar of monitoring. Logging records events that took place at a given time. Supported by most libraries because it is such a fundamental thing.
You only get logs if you actually put them in your code. You also have to make sure you don’t lose them, for instance by aggregating them.
Tools:
- Fluentd: scrape, process and ship logs
- Elasticsearch: a data store
- Kibana: interact with your logs
Metrics
Metrics are a numeric aggregation of data describing the behavior of a component measured over time. They are useful to understand typical system behavior.
Tools:
- Prometheus: scrape data, store the data and query the data
- Grafana: visualize the metrics, can aggregate data from different sources
Alerts are notifications to indicate that a human needs to take action.
Tracing
Tracing is capturing a set of causally related events. Helpful for debugging. Example: each request has a global ID and if you insert this ID as metadata at each step, you can trace what happens.
Tools: Jaeger and Zipkin can visualize and inspect traces.
The challenge is that tracing is hard to retrofit into an existing application. You need to instrument all component. Service meshes can make it easier to retrofit tracing.
Service meshes
A service mesh is a configurable infrastructure layer for microservice applications. It can monitor and control the traffic in your environment. It can be a great approach for observability. You will get less information from a service mesh compared to adding tracing to all of your components, but on the other hand it takes less effort to implement than instrumenting your existing code base.
Tools:
Using service meshes won’t eliminate the need to instrument your code, but it can make your life more simple.
-
Called Traefik Mesh these days. ↩︎